2015 Ed Choice Legislation – The Way of the Future!

If enacted, the Bright Today Scholarship and Open Enrollment Act of 2015 would become the most innovative and universal school choice program in America! Education Savings Accounts (ESAs) are the way of the future.

[button url=”https://rifreedom.org/?p=13364″ target=”_blank” size=”medium”] Read the ESA policy brief here [/button]

Will RhodeMap RI Lead to Demolished Neighborhoods in RI?

The San Francisco Bay area regional authority, similar to the “Urban Redevelopment Authority” that the controversial RhodeMap RI plan would create, plans to demolish 169,000 single-family homes, despite the outrage and objections of residents.

[button url=”https://rifreedom.org/?p=13267″ target=”_blank” size=”medium”] Read the full post here [/button]

RI General Assembly 2014 Session Freedom Index

Download: Freedom Index 2014 Scorecardlegislator votes, bill explanations, and rankings

Go to main Freedom Index page.

NOW LIVE! Interactive Scorecard

2014 Freedom Index Findings

Ninety-nine (99) different pieces of legislation (counting companion bills once) were evaluated.  The Center judged 76 of them as having a negative effect on freedom.

The average legislator index score of -49.4 indicates that the General Assembly moved Rhode Island in the wrong direction, and that Rhode Islanders are less free than they were in 2013. That result does represent a modest improvement from -56.6 the previous year.  (The lowest possible score is -100.)  However, it’s important to remember that it’s only an improvement in that the General Assembly is harming Rhode Island at a slightly slower rate. Actual improvement has yet to be made.

This index underscores our Center’s view that the RI General Assembly continues not to positively address the dire business climate of our state and that a Constitutional Convention may be the only way to move the Ocean State toward growth and an improved standard of living.

freedom-index-spiral-2014-web

Other findings include:

  • Average House index of -51.0 (up from -58.6)
  • Average Senate index of -46.7 (up from -52.4)
  • Average House Democrat index of -53.8 (up from -63.1)
  • Average House Republican index of -19.1 (down from -7.1)
  • Average Senate Democrat index of -48.5 (up from -56.1)
  • Average Senate Republican index of -38.0 (down from -33.2)
  • Average Regulatory Environment index of -47.1 (up from -67.5)
  • Average Tax & Budget index of -56.4 (down from -37.2)
  • Average Constitutional Government index of -4.8 (up from -61.6)
  • Average Public Sector Labor index of -69.5 (down from -44.0)
  • Average Education Reform index of -23.1 (up from -86.4)

ricfp-freedomindexandcategories2014-web

RI General Assembly 2013 Session Freedom Index

Download: Freedom Index 2013 Scorecard;   legislator votes, bill explanations, and rankings 

The second-annual General Assembly Freedom Index by the RI Center for Freedom & Prosperity scores Ocean State lawmakers on their level of support for principles of freedom as proven by their votes on the floors of the House and Senate. In response to IRS proposals that would limit the activities of non-profit groups like our Center, the Center released its initial version with legislators names redacted, identifying them only by chamber, party, and district (Read related commentary here). The full, non-redacted version is now released.

The index examines legislators’ votes in terms of their likely effect on the free market, the size and scope of government, the balance of residents’ interests against those of public employees and beneficiaries, and the constitutional structure of a divided government with limited power over the people whom it represents. The Center reviewed every bill that received a roll-call vote by the full membership of either chamber and selected 96 that fit its understanding of these criteria. (Companion bills only count once.)

The resulting scores give a detailed sense of each legislator’s priorities beyond a few high-profile issues.

The Center further divided the bills into five categories:

  • Tax & budget:  bills that affect the tax structure in Rhode Island and/or that relate to government expenditures, just driving or relieving the pressure on taxation
  • Regulatory environment: bills that make it more or less difficult to live and do business in the state by imposing regulations
  • Constitutional government: bills that affect the structure of the government, as well as the scope of government in its authority over residents’ lives
  • Public sector labor: bills related to the relationship between its employees and itself and the electorate
  • Education reform: bills that advance or impede the reform of the state’s public education system, in terms of both cost and quality

Most legislation has implications for more than one of these categories.  For the purposes of this index, we applied our subjective sense of the area of core effect and sorted the bills accordingly.  If, for example, a bill having to do with education seemed to us intended to secure the role of public employees, we classified that bill as Public Sector Labor, not Education Reform.

Download: Freedom Index 2013 Scorecard; legislator votes, bill explanations, and rankings 

2013 Freedom Index Findings

One hundred and sixteen (116) different pieces of legislation (counting companion bills once) were evaluated.  The Center judged 93 of them as having a negative effect on freedom.

The average legislator index score of -56.6 indicates that the General Assembly moved Rhode Island in the wrong direction, and that Rhode Islanders are less free than they were in 2012. What’s more, that result is down from -25.4 the previous year.  (The lowest possible score is -100.)  In other words, legislators aren’t even trending in the direction of the right direction. This index underscores our Center’s view that the RI General Assembly continues not to positively address the dire business climate of our state.

freedom-index-spiral-2013-web

Other findings include;

  • Average House index of -58.6 (down from -24.1)
  • Average Senate index of -52.4 (down from -27.9)
  • Average House Democrat index of -63.1 (down from -32.2)
  • Average House Republican index of -7.1 (down from 28.8)
  • Average Senate Democrat index of -56.1 (down from -36.3)
  • Average Senate Republican index of -33.2 (down from 1)
  • Average Regulatory Environment index of -67.5 (down from -49.0)
  • Average Tax & Budget index of -37.2 (down from -26.0)
  • Average Constitutional Government index of -61.6 (down from -9.1)
  • Average Public Sector Labor index of -44.0 (down from 16.7)
  • Average Education Reform index of -86.4 (there were no bills in this category last year)

ricfp-freedomindexandcategories2013-web


Index Overview

The Center selected legislative bills for inclusion in the Freedom Index if they were deemed to have an effect on free-market, small-government, or constitutional principles, with each bill assigned a positive or negative weighting based on the criteria listed below. Weighted points for each bill were given to each legislator based on his or her roll-call vote on it.

Each legislator’s final Freedom Index was calculated as his or her score’s percentage of the total possible points. A positive score indicates a 2013 voting record that generally protected individual and economic freedoms, while a negative score reflects the opposite.

Disclaimer: It should be noted that the total Freedom Index score generated for each legislator is a direct reflection of the perspective of the RI Center for Freedom & Prosperity when it comes to the weighting of each bill. The Freedom Index is not an absolute measure of a legislator’s merit and does not constitute any endorsement or individual criticism. The Freedom Index is a tool designed for general research and for accountability, giving voters some quantitative metrics for their own assessments as to their elected legislators’ performance. 

Methodology

1) Determine weighting: Each selected bill received a weight ranging from +3 to -3, as determined by the RI Center for Freedom & Prosperity. Negative weights indicate legislation that creates or expands an agency, government program/function, or tax; creates new regulatory burdens; is hostile to constitutional principles; or otherwise conflicts with the principles that guide the Center. Positive factors were assigned to bills in line with those principles. Companion bills in the House and Senate were weighted identically. To determine the weightings, the Center requested reviews of all chosen legislation from a half dozen engaged Rhode Islanders with similar principles and combined the range of results for a final weighting.

2) Determine vote: Each legislator received a +1 or -1 vote factor, depending on whether he or she voted FOR or AGAINST a particular bill, respectively. If a legislator did not vote on a bill, he or she received a +0.25 if the bill passed or a -0.25 if the bill failed. Legislators who abstained from voting received a +0.75 or a -0.75 vote factor depending on if the bill passed or failed.

3) Calculate weighted vote: Multiplying the weighting factor and the vote factor produced a weighted vote score for each legislator for each bill.

4) Calculate the legislator score:  The cumulative score for all bills for each legislator determined that legislator’s overall score.

5) Calculate Freedom Index: Dividing each legislator’s total score by the maximum possible for the appropriate chamber provided his or her Freedom Index, or a percentage of the best possible score he or she could have achieved. In 2012, the “perfect” scores are 143 for the House and 133 for the Senate.

For example, consider a bill that would increase the regulatory burden significantly in Rhode Island and that the Center therefore weighted as a -2. Legislator A voted for the bill. His or her weighted vote would be calculated as follows: -2 x 1 = -2. Conversely, the weighted vote for Legislator B, who voted against the bill, would be: -2 x -1 = 2.

If Legislator A, in the House chamber, earned a total legislator score of -33, his or her Freedom Index would be calculated as: -33 ÷ 143 x 100 =  -23.1.  If Legislator B in the Senate had a total score of +23, his or her Freedom Index would be calculated as: 23 ÷ 133 x 100 = 17.3.

To rank the legislators, the Center sorted them by their Freedom Index scores and then, in the cases of ties, by their scores in each category, in the following order: Regulatory Environment, Tax & Budget, Constitutional Government, Public Sector Labor, and Education Reform. When legislators’ results were still identical, the Center adjusted them in order of their apparent stature and power within their chambers.

Criteria

In determining each bill’s weighting, the following questions were considered:

  • Does the bill create or eliminate an agency, program, or function of government?
  • Does it give the government new or expanded power to prohibit or restrict activities in the free market? Examples may include licensure and other restrictions on legal business practices.
  • Is it unconstitutional or does it do violence to our concepts of federalism or separation of powers? Does it restrict property, speech, gun, or other constitutionally recognized rights or freedoms? Conversely, does it restore balance between the state and federal government, resume state authority over an issue under the 10th Amendment, or remove restrictions on constitutionally protected rights?

Other considerations were also brought into question:

  • Does the bill redistribute wealth or use tax policy or other incentives to reward specific interest groups with special favors or perks? Conversely, does it eliminate special favors and perks in the tax code or public policy?
  • Does it perform a function that can and should be performed by the private sector or restore functions to the private sector?
  • Does it grow or shrink the regulatory scope of an agency?
  • Does it directly or indirectly create/reduce taxes, fees, or other assessments?
  • Does it increase or decrease control of the private sector through rules, regulation, or statute?
  • Does it increase or decrease long-term debt or override or restore statutory or constitutional protections against long-term debt?
  • Does it give or reduce special benefits for government employees or politicians?
  • Does it promote government transparency and openness or does it restrict access to information that should be in the public domain?

It should be noted that the complexity not only of the law but of political theory in general can make assessments of the sort described above subjective and very difficult. People reviewing the index should consider the results to be the best judgment of the Center, given our collected experience and expertise.

Download: Freedom Index 2013 Scorecard; legislator votes, bill explanations, and rankings 

Each legislator received a +1 or -1 vote factor, depending on whether he or she voted FOR or AGAINST a particular bill, respectively. If a legislator did not vote on a bill, he or she received a +0.25 if the bill passed or a -0.25 if the bill failed. Legislators who abstained from voting received a +0.75 or a -0.75 vote factor depending on if the bill passed or failed.

Spotlight on $pending Report

OVER $220 MILLION IN WASTEFUL SPENDING detailed.

When the political class says it can’t be done … this is how to pay for tax and other reforms!

School Choice Essay Contest Winners

Read Tiffany’s essay here …  Read Bryan’s essay here …  Listen to Tiffany and Bryan on the Helen Glover Radio Show 920WHJJ-AM

Media Release: July 31, 2013

Providence, RI — In celebrating “Friedman Legacy Day 2013”, the RI Center for Freedom & Prosperity will award prizes today to Tiffany Rezendes and Bryan Morillo, the top two essayists in a private essay contest it conducted with the youth-run empowerment organization, People United For Change, based in the Wiggins Village section of Providence.

Friedman Legacy Day is an annual celebration of the life and work of Milton Friedman, a Nobel Prize winning economist and one of the early pioneers of school choice in America. Today would have been Friedman’s 101st birthday.

Tiffany Rezendes and Bryan Morillo were announced as the top two essayist in the 2013 Milton Friedman Legacy Day Essay Contest celebration. Thanks to People United for Change for partnering with our Center.

Tiffany Rezendes and Bryan Morillo were announced as the top two essayist in the 2013 Milton Friedman Legacy Day Essay Contest celebration. Thanks to People United for Change for partnering with our Center.

Essayists were asked to write about how school choice has, or may have, made a difference in their lives or in someone they know. Both winners attended Providence district schools and each will receive an IPad donated by a Board member of the Center.

“A major assertion of Milton Friedman was echoed as a common theme in the personal essays we received; namely, that poor families are most affected by a lack of school choice,” said Mike Stenhouse, CEO of the Center. “He believed that residents of low-income neighborhoods, more than any other population, are disadvantaged as to the quality of schooling they can get for their children.”

Rezendes, 20, wrote about how one of her closest friends dropped out of high school due to a lack of a challenging curriculum in her Providence school, with no option to choose a school that was better suited to her interests, and how “she just gave up once she found out she wasn’t accepted into Classical because all her hopes of having a great education had to be lowered to settle for a below average school experience.”

Morillo, 17, discussed how lack of choice in schools “condemned the students of providence (sic) to an attitude of ‘sit at home and collect a check’ … ” because of a curriculum that left many “unprepared for the real world”, and “making it easy to simply go through the motions …”

People United for Change is a youth-run organization based at Wiggins Village in Providence, focused on empowering people to bring about positive and meaningful change, through unity, to the city of Providence and the state of Rhode Island.

Read Tiffany’s essay here …

Read Bryan’s essay here …

ABOUT the Contest

The School Choice Essay Contest asked students to write about how school choice could have positively affected their life, or someone close to them. Essays were scored from 1-10 in each of four categories: emotional appeal, realism, defense of school choice, and quality of writing. Each of the five judges read and scored each essay.

JUDGING PANEL

Dr. Angela Dills, PhD – Economics Professor, Providence College. Doctor Dills has championed school choice for several years through research and speaking.

Matthew Fabisch – Attorney, Stephen Hopkins Center for Civil Rights. Matt has worked extensively on the legality and principles surrounding school choice.

Creusa Michelazzo – Providence-based small business owner. Macremi specializes in PR, production, and community/business development.

Akash Chougule – Outreach Coordinator, RI Center for Freedom. Akash conducts the Center’s youth outreach to state and national liberty organizations.

Tyler Tassinari – Student, Arizona State University and Center Intern. Tyler is spending his summer doing school choice research for the Center.

RI Medicaid Abuse Puts New Spin on “Laundering” Taxpayer Dollars

MEDIA: NBC- Channel 10, ABC Channel 6

The State of Rhode Island has developed a new spin on the idea of “laundering” money, as part of the cycle of taxpayer dollars that end up in the pockets of the special few, according to a follow-up post today on The Ocean State Current, the journalism wing of the RI Center for Freedom & Prosperity.

According to the post by Justin Katz, some unionized laundry workers at the Eleanor Slater Hospital, and throughout the Department of Behavioral Healthcare, Developmental Disabilities and Hospitals (BHDDH), routinely double or even triple their salaries to take home over $123,000 per year, due to suspiciously high overtime payments.

The post follows an investigative article published yesterday in The Ocean State Current about six-figure overtime payments to government employed nurses and psychiatrists.

These new laundry worker revelations depict the waste and abuse in the laundering scheme where local and national taxpayer dollars are recycled first through the government via collection of taxes, then, in the Eleanor Slater case, sent to state-run facilities in the form of excessive Medicaid payments, with the money then further cycled directly into the pockets of privileged union employees – in this case, to laundry workers via exorbitant overtime payments.

Result: our hard-earned taxpayer dollars legally recycled to lavishly benefit government workers.

The data for The Current’s article and post was collected by the Center, as part of its transparency effort.For more information about salary and overtime payments made to other state employees, please visit our popular transparency website, www.RIOpenGov.org.

Zero.Zero 2013

ELIMINATE THE STATE SALES TAX TO CREATE JOBS: The RI Center for Freedom & Prosperity proposes the elimination of Rhode Island’s sales tax as a means of high-impact economic development. Our RI-STAMP economic model suggests that the loss in state revenue would not be as large as static projections might suggest and would be well worth the boon to Rhode Islanders across the state.

Second-Year Report Card: Lack of Bold Action = Lack of Improvement

Related Links: 2012 Report Card

It isn’t surprising that a year of no bold legislative or executive action to free the Rhode Island economy or education system from its shackles, or to lighten the heavy hand of government, was a year of no significant improvement in the RI Center for Freedom & Prosperity’s annual Report Card on RI Competitiveness.

What changes the Ocean State saw in the report card’s ten major categories came in large part due to changes of the subcategories, a technical change in the Center’s methodology, and tiny shifts that were able to cross a line into a new letter grade.  In 2012, Rhode Island had five grades of F, two of D-, two of D, and one of D+. In 2013, the tally is three of F, four of D-, one of D, and two of D+. (One of the lost Fs was purely a change in the method of ranking states.)

The sheer number of below-average grades does much to explain Rhode Island’s continuing economic decline and population exodus.

“For all the talk last year about the positive legislative steps we supposedly took, the state’s dismal grade point average has barely moved”, said the Center’s CEO, Mike Stenhouse. “We’ve all seen the depressing headlines, but when compiled into a single report, the report card shows how poor public policy is strangling economic opportunities for families in our state.”

The report card organizes 53 national rankings into the following major categories:

  • Tax Burden (D-)
  • Business Climate (F)
  • Spending & Debt (D-)
  • Employment & Income (D-)
  • K-12 Education (D+)
  • Energy (D+)
  • Infrastructure (F)
  • Public Sector (D)
  • Health Care (D-)
  • Living & Retiring in RI (F)

Whether the decision is thoroughly researched or simply based on impressions, these are the categories on which the Ocean State is judged when businesses and individuals make important decisions about their lives and their economic well-being. Having the information all in one place may be discouraging, but it gives those with a vested interest in the health of the State of Rhode Island clear guidelines for what problems must be addressed.

RI Public and Private Sector Compensation Comparison

Related Media: Report Finds RI Government Workers Out-Earn Private Sector (GoLocalProv), Guest opinion: Public employees would benefit from pro-growth policies (The Herald News), Tie the Public to the Private  (GoLocalProv), Mike Stenhouse on the Helen Glover show (920 WHJJ);  RI Owes $81 Million in Unused Sick, Vacation Time (GoLocalProv)

Download: Executive summary; full report with methodology (PDF)

Executive Summary

State and local government workers enjoy significantly higher compensation levels than their private sector counterparts, according to data compiled for Rhode Island as part of a national study conducted by economists William Even, of Miami University, and David Macpherson, of Trinity University.

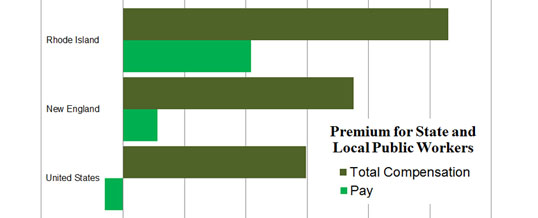
Even and Macpherson apply the most complete controls for such variables as education, experience, and broad job category and the most accurate accounting of benefits to date. They find that state and local government workers across the country receive a “premium” above their private-sector neighbors, but Rhode Island amplifies the difference:

  • Rhode Island: 26.5% higher total compensation
  • New England: 18.8% higher total compensation
  • United States: 14.9% higher total compensation

Furthermore, a preliminary review of the effects of Rhode Island’s pension reform suggests that the changes to their retirement benefits did not appreciably reduce government workers’ advantage, only reducing the premium for government work to 26.24%.

Looking at base pay alone shows that job security and better benefits in government do not correspond with lower salaries, at least in Rhode Island and New England, where state and local workers receive:

  • Rhode Island: 10.4% higher base pay
  • New England: 2.8% higher base pay
  • United States: 1.5% lower base pay

Averaging all jobs at every level, total public-sector pay and benefits in Rhode Island are competitive with Massachusetts and Connecticut, but private-sector workers earn nearly 25% less than their peers across state borders. Consequently, comparing averages within Rhode Island yields the following results:

  • Total compensation: 20% higher for government workers
  • Pay (base salary): 4% higher for government workers
  • Benefits: 58% higher for government workers
  • Hours worked: 5% less for government workers
  • Value of paid time off: 5% higher for government workers

Compared with the New England region, Rhode Island’s government employees are unique in having a higher average base salary than the private sector as well as a higher value for paid time off. They also enjoy a total compensation premium well above the regional average, even as they work the fewest total hours.

If there is to be any hope of keeping current compensation levels and benefit promises to government workers, the state must experience an immediate boom in the private-sector economy. Without rapid economic growth and a boost to their prosperity, taxpayers’ tolerance and capacity to pay for government beyond their means will continue to wane.

Data Analysis

Overall Averages

Rhode Island’s state and local government employees receive higher compensation than their private-sector neighbors by every measure, according a study comparing public-sector and private-sector compensation that the RI Center for Freedom & Prosperity requested from economists William Even, of Miami University, and David Macpherson, of Trinity University.

Chart 1 shows the average real earnings and benefits (in 2010 dollars) for state and local workers versus private-sector Rhode Islanders. Benefits take into account pensions, health insurance (including post-employment/retiree), other insurance, legally required benefits, like Social Security payments, and paid time off. The total compensation for the average public-sector employee in Rhode Island was $100,217, which was more than 20% higher than the private-sector average of $83,419.

Rhode Island Average Pay and Benefits for Public and Private Sector Workers, 2010

Rhode Island is inarguably in a high-cost, public-labor-friendly region, but even so, it is unique within New England. Chart 2 shows that Rhode Island is the only New England state in which the average wage earnings (base salary) of all state and local workers, on its own, was greater than that for all private-sector workers.

The most conspicuous reason for Rhode Island’s poor showing, here, is the huge gap between its economy and that of the two states that envelop it. While the Ocean State’s public sector is competitive with Connecticut and Massachusetts (with earnings only $4,294, or 6.6%, below the region-leading Bay State), its private sector has a $15,398 (23.3%) deficit.

New England Average Pay for Public and Private Sector Workers by State, 2010

Even when benefits are factored in, the private sectors in Massachusetts and Connecticut outstrip government employees. In contrast, Table 1 shows that Rhode Island adds a relatively large amount of compensation via benefits in its public sector and a relatively low amount in its private sector.

Another significant perk to working in Rhode Island’s public sector is time off. According to the data collected by Even and Macpherson, Rhode Island is the only New England state in which the value of the public sector’s paid time off ($7,208) is greater than the private sector’s ($6,857). (These numbers are included in the total for benefits.)

And while government workers in all New England states put in fewer hours than their private-sector neighbors, Rhode Island’s public employees put in the fewest. Moreover, only in Vermont is the gap between the sectors larger. (Note: Annual hours are calculated from weekly-hour responses on employee surveys.

Variable-Controlled Premiums

A common objection to such comparisons of average pay is that the types of jobs available within the public sector lend themselves to more-highly educated employees. Therefore, the argument goes, it is entirely appropriate for them to make more than the average of all private-sector jobs, because they skew toward the higher end of the workforce.

To investigate this explanation, Even and Macpherson performed a regression analysis for Rhode Island, the New England Census division, and the United States in order to compare similarly situated employees. Chart 3 shows a summary of the results.

The percentage shown is the premium for working in the public sector — that is, the percentage advantage in compensation from working in the public sector, taking into account employee characteristics (such as education and experience) as well as broad job category (such as management versus office and administrative support). (See Table 2.)

On salary alone, state and local employees enjoy a 10.4% premium in Rhode Island, even when controlling for other variables like education, experience, and broad job category. For New England overall, the premium is 2.8%. Nationwide, the public-sector actually has a salary penalty of 1.5% below the private sector.

Rhode Island, New England, and U.S. Premium for State and Local Public Workers in Pay and Total Compensation, 2010

Adding in the total value of benefits (before pension reform), Rhode Island’s state and local workers receive a premium of 26.5% over their similarly situated private-sector counterparts. That compares with 18.8% for New England as a whole and 14.9% nationwide.

A significant consideration that Even and Macpherson were unable to quantify due to a lack of data is job security. Given higher rates of unionization and the ability to affect their employers through political activities, government workers are generally understood to face less volatility than do private-sector employees. In theory, economists could apply a monetary value to that intangible benefit, but such an investigation would be beyond the scope of this study.


Pensions & Pension Reform

One important adjustment that Even and Macpherson have made to the raw compensation data is to determine the current value of pension benefits using a 4% discount rate. In a defined-benefit system, actuaries value the guaranteed level of income that employees will receive during retirement by assuming that investments will produce a certain return.

Rhode Island currently assumes a 7.5% return. Prior to the adjustment that spurred the 2011 pension reform at the state level, the assumption was 8.25%. Because this study uses data from 2010, that is the starting point for this data. By comparison, the average private-sector assumption is 6%.

In all cases, therefore, Even and Macpherson had to mark up benefit values to account for the likelihood that investment profits will fall short of predictions. It may seem counterintuitive that a benefit is worth more when invested money receives less profit. However, in the case of guaranteed pensions, the benefit is defined in the future, not the present.

Therefore, lower profits from investments would require greater payments by the employer, making the benefit of greater value to the employee now. In effect, the employer is promising a greater return to the worker than he or she would be able to achieve by investing on his or her own.

Because pensions make up 10-20% of the typical government employee’s total compensation, compared with 4-6% in the private sector, large reforms can greatly affect the premium that public-sector workers receive over the private market-place. For this study to be complete, therefore, some accounting of the effect of the Ocean State’s pension reform on the value of state employees’ benefit packages had to be included.

However, the imposing complexity of pension calculations is such that an accurate estimate of the reform’s effects would be well beyond Even and Macpherson’s scope. In particular, during the transition from the defined benefits pension to the newly developed hybrid plan, each individual employee’s benefit will be different, and results vary from job to job and across state and local governments. It will be a matter of years before accurate data is available.

Consequently, the public-sector premium given above can be considered the outcome if the lawsuit currently pending on behalf of the relevant labor unions succeeds in overturning the reform. For some sense of the result if the state prevails in its defense of the reform, the Center for Freedom & Prosperity asked Even and Macpherson to provide a rough calculation.

It’s important to note, here, that the pension data throughout this study assumes that all municipal employees are receiving the same weighted average contribution as those in the state’s two largest plans — state workers and teachers — with and without 2011’s reform.

Be that as it may, the effect of the reform on this study was relatively minor. The guaranteed payments provided through the defined-benefit portion of the state’s new hybrid pension system have gone down. But the state has increased the percentage of payroll that it must contribute each year, to make up for the 5% of their pay that employees are putting toward their defined-contribution plans. The state has added a 1%-of-payroll contribution to those plans, as well.

Consequently, the annual value of government employees’ pension benefit has only decreased from $10,692 to an estimated $10,476. In terms of the “premium” that state and local workers receive over similarly situated private-sector Rhode Islanders, the percentage advantage has decreased from 26.49% to 26.24%.

Policy Analysis

Living Beyond Our Means

When a family comes to a decision about purchasing any product or service, it doesn’t merely accept the seller’s sense of what’s reasonable. In addition to the market rate, consumers must take into account the quality of the thing they’re buying as well as their own ability to afford it.

With deteriorating infrastructure, doubts about the quality of government services, and the high-profile specter of unfunded municipal and state retirement liabilities looming over the state during this current period of economic stagnation, the compensation of public-sector employees has become a subject of heated debate about fairness and affordability.

Rhode Island is the only state in New England in which public employees have higher base salaries than the private sector. At the same time, state and local workers in the Ocean State work the fewest hours in the region. When benefits are factored in, Rhode Island has the highest premium for public-sector workers over private-sector workers, even if pension reform survives the lawsuit that unions have filed to overthrow it.

Meanwhile, the state’s economy is reeling, with arguably the worst employment picture in the United States, certainly the region. With dwindling taxable incomes and general economic activity, the state and its cities and towns will not long be able to continue to squeeze more revenue from a population that is losing ground economically and seeing many of its productive residents and college graduates flee to states with healthier economies.

Adjustments around the edges that do not take on the significant public policy issues we face will not be sufficient to turn the state around. Without rapid economic growth and a boost to their prosperity, taxpayers’ tolerance and capacity to pay for government beyond their means will continue to wane. Painful struggles between powerful insiders and the average citizen will worsen. Even more taxpayers may decide that the battle is not worth the benefits of living within the Ocean State’s borders.

Economic Growth Benefits Public and Private Sectors

With all of the emphasis on improving economic development in Rhode Island, there have been two conspicuous omissions.

The first is the need for a complete change in the way that state and local governments treat taxpayers and businesses — as a matter of regulation, as a matter of spending, and as a matter of taxation.

The second, as emphasized in the data revealed in this study, is the fact that government workers should be out in front of the crowd advocating for change — not for tax-the-rich schemes that will never produce sufficient revenue, but for precisely the policies founded in economic liberty that will close the gap between private-sector Rhode Island’s earnings and those of its nearest neighbors.

If there is to be any hope of keeping current compensation levels and benefit promises to government workers, the state must experience an immediate boom in the private-sector economy.

Even the dramatic pension reform that sent unions to their lawyers and made state Treasurer Gina Raimondo a national policy star barely nudged Rhode Island’s public sector toward the national ratio of public-to-private workers. It hardly even brought the tiny Ocean State nearer to the average for the union-stronghold region of New England.

While additional compensation cuts and even deeper benefit reforms will be necessary in the public sector, the more significant factor in the public-private imbalance, locally, comes from the substandard economic conditions in which the Rhode Island taxpayer in the private sector is forced to survive. That is where dramatic improvement is most necessary, and most attainable, if public policy can be properly aligned.

Central Falls retirees discovered all too painfully that unsustainable compensation arrangements, whether salaries or benefits, are by no means guaranteed if obvious warning signs are not acted upon responsibly. The comparison of the public sector and the private sector in Rhode Island is one such sign of unsustainable compensation levels.

The people of Rhode Island depend upon government workers for the appropriate and necessary functions of government, but those workers depend upon the private sector to maintain a healthy economy and, in turn, sufficient government revenue. The top priority for employees on both sides of Rhode Island’s taxing and spending, therefore, should be reasonable reform that makes public-employee compensation sustain-able combined with the elimination of policies that restrain economic growth in the Ocean State.

Methodology

Download the PDF version of this report for Even and Macpherson’s full methodology.