RI General Assembly Freedom Index
Download: Freedom Index 2012 Scorecard; legislator votes, bill explanations, and rankings ; Click here for the Media Release
Radio: Stenhouse discusses Index on Dan Yorke radio show ; and on the Helen Glover show (@ the 13:00 minute mark)
The first-annual General Assembly Freedom Index by the RI Center for Freedom & Prosperity scores Ocean State lawmakers on their level of support for principles of freedom as proven by their votes on the floors of the House and Senate.
The index examines legislators’ votes in terms of their likely effect on the free market, the size and scope of government, the balance of residents’ interests against those of public employees and beneficiaries, and the constitutional structure of a divided government with limited power over the people whom it represents. The Center reviewed every bill that received a roll-call vote by the full membership of either chamber and selected 96 that fit its understanding of these criteria. (Companion bills only count once.)
The resulting scores give a detailed sense of each legislator’s priorities beyond a few high-profile issues.
The Center further divided the bills into five categories:
- Tax & budget: bills that affect the tax structure in Rhode Island and/or that relate to government expenditures, just driving or relieving the pressure on taxation
- Regulatory environment: bills that make it more or less difficult to live and do business in the state by imposing regulations
- Constitutional government: bills that affect the structure of the government, as well as the scope of government in its authority over residents’ lives
- Public sector labor: bills related to the relationship between its employees and itself and the electorate
- Education reform: bills that advance or impede the reform of the state’s public education system, in terms of both cost and quality
Most legislation has implications for more than one of these categories. For the purposes of this index, we applied our subjective sense of the area of core effect and sorted the bills accordingly. If, for example, a bill having to do with education seemed to us intended to secure the role of public employees, we classified that bill as Public Sector Labor, not Education Reform.
Download: Freedom Index 2012 Scorecard; legislator votes, bill explanations, and rankings
2012 Freedom Index Findings
Ninety-six (96) different pieces of legislation (counting companion bills once) were evaluated. The Center judged 70 of them as having a negative effect on freedom.
The average legislator index score of -25.4 indicates that the General Assembly moved Rhode Island in the wrong direction, and that Rhode Islanders are less free than they were in 2011. This index underscores our Center’s view that the 2012 RI General Assembly did not positively address the dire business climate of our state.
Top and Bottom 10
| House | Senate | ||
| Top 10 | Bottom 10 | Top 10 | Bottom 10 |
| 1 Costa 59.2 | 113 Bennett -46.0 | 1 Kettle 15.5 | 113 Tassoni -44.8 |
| 2 Gordon 58.7 | 112 Fox -45.3 | 2 Shibley 14.0 | 112 Lanzi -44.8 |
| 3 Newberry 42.0 | 111 Ajello -45.3 | 3 Moura 8.6 | 111 DaPonte -43.1 |
| 4 Chippendale 41.7 | 110 McNamara -45.3 | 4 Hodgson 5.2 | 110 Miller -42.0 |
| 5 Watson 33.5 | 109 Valencia -45.3 | 5 Maher 4.1 | 109 Lynch -42.0 |
| 6 Trillo 28.8 | 108 Blazejewski -45.3 | 6 Algiere -7.8 | 108 Perry -41.6 |
| 7 Morgan 15.3 | 107 Cimini -45.3 | 7 Pinga -12.1 | 107 Ruggerio -41.4 |
| 8 Ehrhardt 15.1 | 106 Silva -45.3 | 8 Bates -14.7 | 106 Goodwin -41.4 |
| 9 Reilly 13.2 | 105 Mattiello -44.6 | 9 Ottiano -17.0 | 105 McCaffrey -41.4 |
| 10 Palumbo 0.5 | 104 Ucci -44.6 | 10 Cote -17.7 | 104 Fogarty -41.4 |
Other findings include;
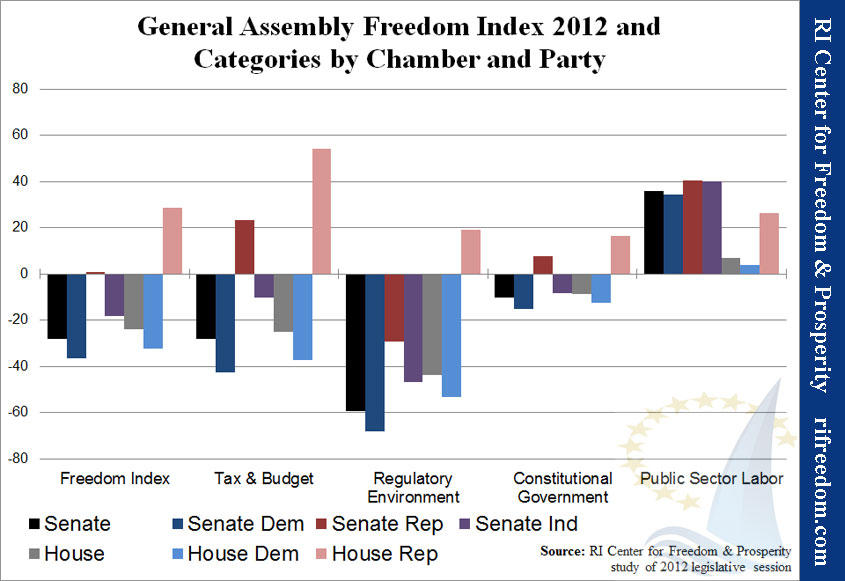
- Average House index of -24.1
- Average Senate index of -27.9
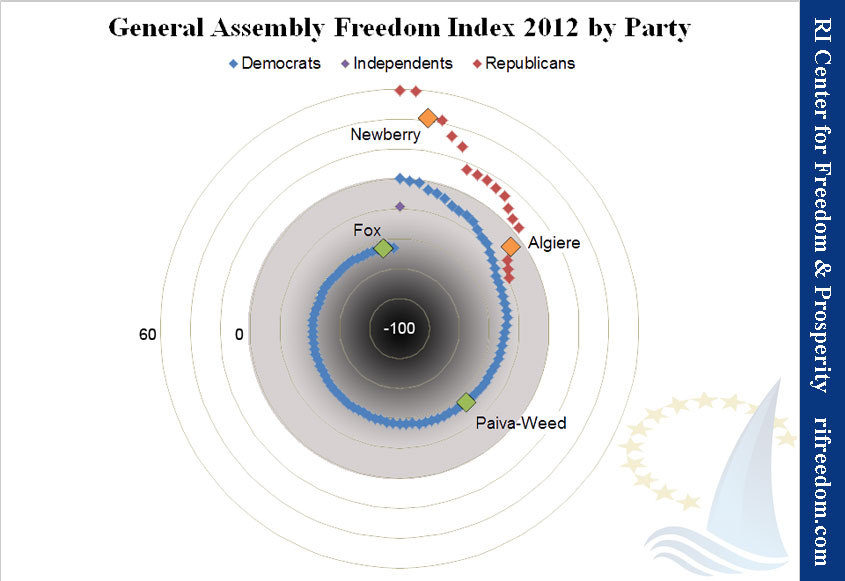
- Average Democrat index of -33.5
- Average Republican index of 16.5
- Average Regulatory Environment index of -49.0
- Average Tax & Budget index of -26.0
- Average Constitutional Government index of -9.1
- Average Public Sector Labor index of 16.7
- No bills directly related to Education Reform were scored in this index
Tax & Budget Category, Top and Bottom 10
| House | Senate | ||
| Top 10 | Bottom 10 | Top 10 | Bottom 10 |
| 1 Newberry 68.8 | 75 Silva -67.2 | 1 Kettle 44.8 | 38 Pichardo -59.5 |
| 2 Chippendale 68.8 | 74 Bennett -62.5 | 2 Shibley 44.8 | 37 Lynch -54.3 |
| 3 Watson 68.0 | 73 Fox -62.5 | 3 Hodgson 44.8 | 36 Crowley -54.3 |
| 4 Trillo 67.2 | 72 Ajello -62.5 | 4 Moura 31.0 | 35 Tassoni -51.7 |
| 5 Costa 66.4 | 71 McNamara -62.5 | 5 Maher 24.1 | 34 Lanzi -51.7 |
| 6 Gordon 66.4 | 70 Valencia -62.5 | 6 Algiere 17.2 | 33 DaPonte -51.7 |
| 7 DaSilva 54.7 | 69 Blazejewski -62.5 | 7 Felag 10.3 | 32 Miller -51.7 |
| 8 Morgan 43.8 | 68 Cimini -62.5 | 8 Pinga 10.3 | 31 Perry -51.7 |
| 9 Reilly 43.8 | 67 Mattiello -62.5 | 9 Bates 10.3 | 30 Ruggerio -51.7 |
| 10 Lima 43.8 | 66 Ucci -62.5 | 10 Ottiano 10.3 | 29 Goodwin -51.7 |
Regulatory Environment Category, Top and Bottom 10
| House | Senate | ||
| Top 10 | Bottom 10 | Top 10 | Bottom 10 |
| 1 Gordon 66.9 | 75 Mattiello -66.9 | 1 Hodgson -18.0 | 38 Miller -76.3 |
| 2 Costa 55.2 | 74 Tarro -66.9 | 2 Kettle -23.1 | 37 Tassoni -74.4 |
| 3 Watson 52.2 | 73 Naughton -66.9 | 3 Shibley -23.1 | 36 Lanzi -74.4 |
| 4 Chippendale 27.2 | 72 Corvese -66.9 | 4 Moura -23.1 | 35 Lynch -74.4 |
| 5 Newberry 23.5 | 71 Bennett -64.7 | 5 Maher -31.4 | 34 Perry -74.4 |
| 6 Trillo 17.6 | 70 Fox -64.7 | 6 Bates -33.3 | 33 Ruggerio -74.4 |
| 7 Ehrhardt 15.4 | 69 Ajello -64.7 | 7 Algiere -35.9 | 32 Goodwin -74.4 |
| 8 Reilly 0.0 | 68 McNamara -64.7 | 8 Pinga -41.7 | 31 McCaffrey -74.4 |
| 9 Morgan -7.4 | 67 Valencia -64.7 | 9 Lombardo -43.0 | 30 Fogarty -74.4 |
| 10 MacBeth -7.4 | 66 Blazejewski -64.7 | 10 Cote -43.6 | 29 Sosnowski -74.4 |
Constitutional Government Category, Top and Bottom 10
| House | Senate | ||
| Top 10 | Bottom 10 | Top 10 | Bottom 10 |
| 1 Costa 61.2 | 75 Hearn -31.0 | 1 Kettle 29.7 | 38 DaPonte -29.1 |
| 2 Gordon 38.8 | 74 Jacquard -25.0 | 2 Shibley 24.3 | 37 Perry -19.6 |
| 3 Chippendale 36.2 | 73 MacBeth -22.4 | 3 Moura 18.9 | 36 Tassoni -18.9 |
| 4 Newberry 32.8 | 72 Bennett -19.8 | 4 Maher 18.9 | 35 Lanzi -18.9 |
| 5 Morgan 12.9 | 71 Hull -19.0 | 5 Pinga 6.1 | 34 Miller -18.9 |
| 6 Palumbo 6.0 | 70 Fox -17.2 | 6 Cote 6.1 | 33 Lynch -18.9 |
| 7 Flaherty 6.0 | 69 Ajello -17.2 | 7 Sheehan -2.0 | 32 Ruggerio -18.9 |
| 8 DeSimone 5.2 | 68 McNamara -17.2 | 8 Ottiano -4.1 | 31 Goodwin -18.9 |
| 9 Trillo 4.3 | 67 Valencia -17.2 | 9 Hodgson -8.1 | 30 McCaffrey -18.9 |
| 10 Schadone 3.5 | 66 Blazejewski -17.2 | 10 Algiere -8.1 | 29 Fogarty -18.9 |
Index Overview
The Center selected legislative bills for inclusion in the Freedom Index if they were deemed to have an effect on free-market, small-government, or constitutional principles, with each bill assigned a positive or negative weighting based on the criteria listed below. Weighted points for each bill were given to each legislator based on his or her roll-call vote on it.
Each legislator’s final Freedom Index was calculated as his or her score’s percentage of the total possible points. A positive score indicates a 2012 voting record that generally protected individual and economic freedoms, while a negative score reflects the opposite.
Disclaimer: It should be noted that the total Freedom Index score generated for each legislator is a direct reflection of the perspective of the RI Center for Freedom & Prosperity when it comes to the weighting of each bill. The Freedom Index is not an absolute measure of a legislator’s merit and does not constitute any endorsement or individual criticism. The Freedom Index is a tool designed for general research and for accountability, giving voters some quantitative metrics for their own assessments as to their elected legislators’ performance.
Methodology
1) Determine weighting: Each selected bill received a weight ranging from +3 to -3, as determined by the RI Center for Freedom & Prosperity. Negative weights indicate legislation that creates or expands an agency, government program/function, or tax; creates new regulatory burdens; is hostile to constitutional principles; or otherwise conflicts with the principles that guide the Center. Positive factors were assigned to bills in line with those principles. Companion bills in the House and Senate were weighted identically. To determine the weightings, the Center requested reviews of all chosen legislation from a half dozen engaged Rhode Islanders with similar principles and combined the range of results for a final weighting.
2) Determine vote: Each legislator received a +1 or -1 vote factor, depending on whether he or she voted FOR or AGAINST a particular bill, respectively. If a legislator did not vote on a bill, he or she received a +0.25 if the bill passed or a -0.25 if the bill failed. Legislators who abstained from voting received a +0.75 or a -0.75 vote factor depending on if the bill passed or failed.
3) Calculate weighted vote: Multiplying the weighting factor and the vote factor produced a weighted vote score for each legislator for each bill.
4) Calculate the legislator score: The cumulative score for all bills for each legislator determined that legislator’s overall score.
5) Calculate Freedom Index: Dividing each legislator’s total score by the maximum possible for the appropriate chamber provided his or her Freedom Index, or a percentage of the best possible score he or she could have achieved. In 2012, the “perfect” scores are 106 for the House and 116 for the Senate.
For example, consider a bill that would increase the regulatory burden significantly in Rhode Island and that the Center therefore weighted as a -2. Legislator A voted for the bill. His or her weighted vote would be calculated as follows: -2 x 1 = -2. Conversely, the weighted vote for Legislator B, who voted against the bill, would be: -2 x -1 = 2.
If Legislator A, in the House chamber, earned a total legislator score of -33, his or her Freedom Index would be calculated as: -33 ÷ 106 x 100 = -31.1. If Legislator B in the Senate had a total score of +23, his or her Freedom Index would be calculated as: 23 ÷ 116 x 100 = 19.8.
To rank the legislators, the Center sorted them by their Freedom Index scores and then, in the cases of ties, by their scores in each category, in the following order: Regulatory Environment, Tax & Budget, Constitutional Government, Public Sector Labor, and Education Reform. When legislators’ results were still identical, the Center adjusted them in order of their apparent stature and power within their chambers.
Criteria
In determining each bill’s weighting, the following questions were considered:
- Does the bill create or eliminate an agency, program, or function of government?
- Does it give the government new or expanded power to prohibit or restrict activities in the free market? Examples may include licensure and other restrictions on legal business practices.
- Is it unconstitutional or does it do violence to our concepts of federalism or separation of powers? Does it restrict property, speech, gun, or other constitutionally recognized rights or freedoms? Conversely, does it restore balance between the state and federal government, resume state authority over an issue under the 10th Amendment, or remove restrictions on constitutionally protected rights?
Other considerations were also brought into question:
- Does the bill redistribute wealth or use tax policy or other incentives to reward specific interest groups with special favors or perks? Conversely, does it eliminate special favors and perks in the tax code or public policy?
- Does it perform a function that can and should be performed by the private sector or restore functions to the private sector?
- Does it grow or shrink the regulatory scope of an agency?
- Does it directly or indirectly create/reduce taxes, fees, or other assessments?
- Does it increase or decrease control of the private sector through rules, regulation, or statute?
- Does it increase or decrease long-term debt or override or restore statutory or constitutional protections against long-term debt?
- Does it give or reduce special benefits for government employees or politicians?
- Does it promote government transparency and openness or does it restrict access to information that should be in the public domain?
It should be noted that the complexity not only of the law but of political theory in general can make assessments of the sort described above subjective and very difficult. People reviewing the index should consider the results to be the best judgment of the Center, given our collected experience and expertise.
Download: Freedom Index 2012 Scorecard; legislator votes, bill explanations, and rankings


Leave a Reply
Want to join the discussion?Feel free to contribute!