RI Public and Private Sector Compensation Comparison

Related Media: Report Finds RI Government Workers Out-Earn Private Sector (GoLocalProv), Guest opinion: Public employees would benefit from pro-growth policies (The Herald News), Tie the Public to the Private  (GoLocalProv), Mike Stenhouse on the Helen Glover show (920 WHJJ);  RI Owes $81 Million in Unused Sick, Vacation Time (GoLocalProv)

Download: Executive summary; full report with methodology (PDF)

Executive Summary

State and local government workers enjoy significantly higher compensation levels than their private sector counterparts, according to data compiled for Rhode Island as part of a national study conducted by economists William Even, of Miami University, and David Macpherson, of Trinity University.

Even and Macpherson apply the most complete controls for such variables as education, experience, and broad job category and the most accurate accounting of benefits to date. They find that state and local government workers across the country receive a “premium” above their private-sector neighbors, but Rhode Island amplifies the difference:

  • Rhode Island: 26.5% higher total compensation
  • New England: 18.8% higher total compensation
  • United States: 14.9% higher total compensation

Furthermore, a preliminary review of the effects of Rhode Island’s pension reform suggests that the changes to their retirement benefits did not appreciably reduce government workers’ advantage, only reducing the premium for government work to 26.24%.

Looking at base pay alone shows that job security and better benefits in government do not correspond with lower salaries, at least in Rhode Island and New England, where state and local workers receive:

  • Rhode Island: 10.4% higher base pay
  • New England: 2.8% higher base pay
  • United States: 1.5% lower base pay

Averaging all jobs at every level, total public-sector pay and benefits in Rhode Island are competitive with Massachusetts and Connecticut, but private-sector workers earn nearly 25% less than their peers across state borders. Consequently, comparing averages within Rhode Island yields the following results:

  • Total compensation: 20% higher for government workers
  • Pay (base salary): 4% higher for government workers
  • Benefits: 58% higher for government workers
  • Hours worked: 5% less for government workers
  • Value of paid time off: 5% higher for government workers

Compared with the New England region, Rhode Island’s government employees are unique in having a higher average base salary than the private sector as well as a higher value for paid time off. They also enjoy a total compensation premium well above the regional average, even as they work the fewest total hours.

If there is to be any hope of keeping current compensation levels and benefit promises to government workers, the state must experience an immediate boom in the private-sector economy. Without rapid economic growth and a boost to their prosperity, taxpayers’ tolerance and capacity to pay for government beyond their means will continue to wane.

Data Analysis

Overall Averages

Rhode Island’s state and local government employees receive higher compensation than their private-sector neighbors by every measure, according a study comparing public-sector and private-sector compensation that the RI Center for Freedom & Prosperity requested from economists William Even, of Miami University, and David Macpherson, of Trinity University.

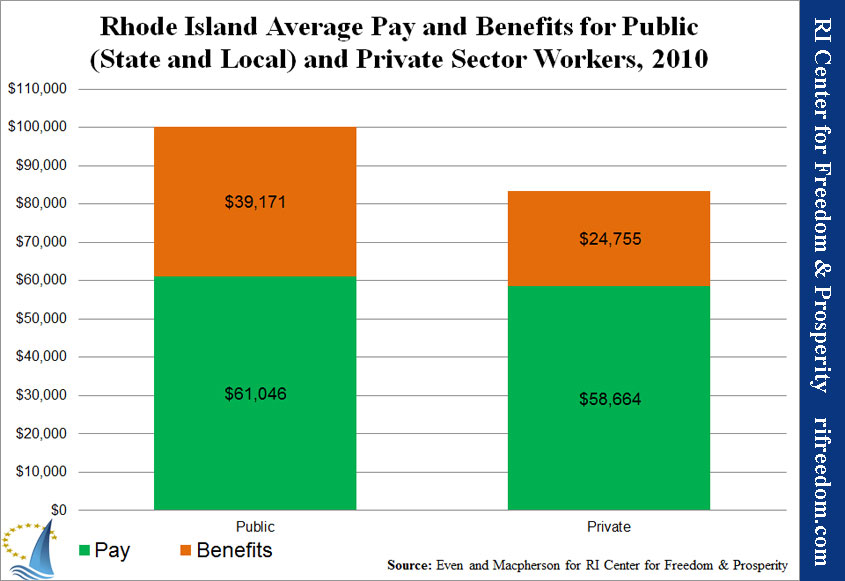
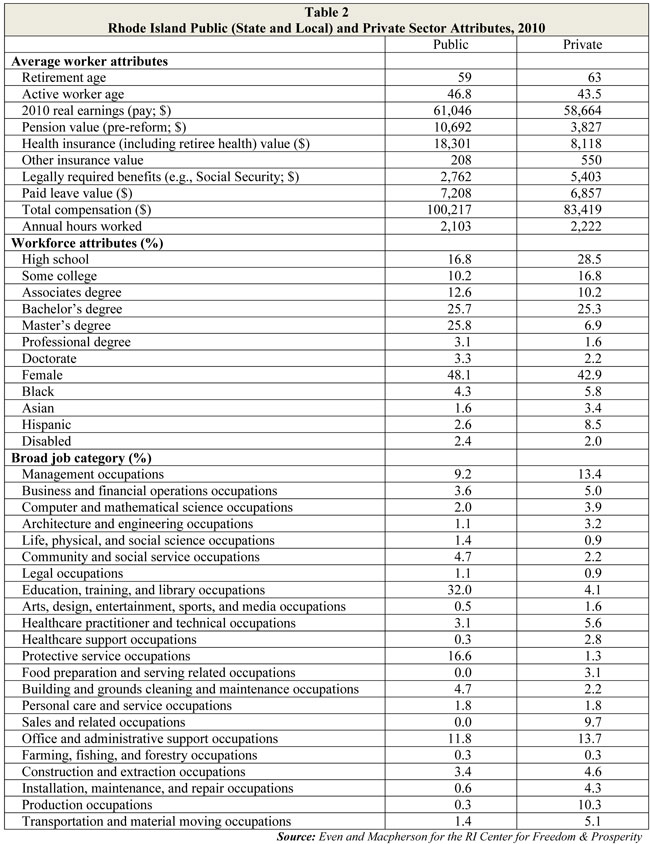
Chart 1 shows the average real earnings and benefits (in 2010 dollars) for state and local workers versus private-sector Rhode Islanders. Benefits take into account pensions, health insurance (including post-employment/retiree), other insurance, legally required benefits, like Social Security payments, and paid time off. The total compensation for the average public-sector employee in Rhode Island was $100,217, which was more than 20% higher than the private-sector average of $83,419.

Rhode Island Average Pay and Benefits for Public and Private Sector Workers, 2010

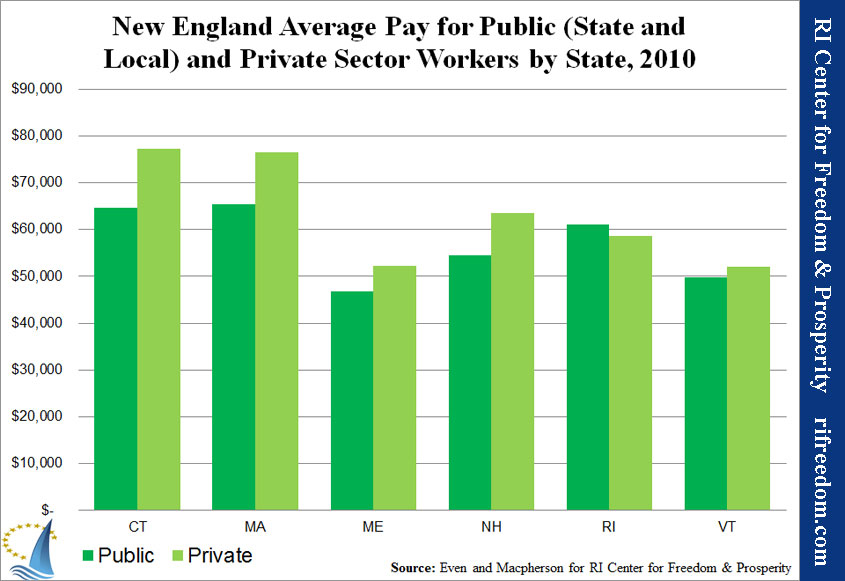
Rhode Island is inarguably in a high-cost, public-labor-friendly region, but even so, it is unique within New England. Chart 2 shows that Rhode Island is the only New England state in which the average wage earnings (base salary) of all state and local workers, on its own, was greater than that for all private-sector workers.

The most conspicuous reason for Rhode Island’s poor showing, here, is the huge gap between its economy and that of the two states that envelop it. While the Ocean State’s public sector is competitive with Connecticut and Massachusetts (with earnings only $4,294, or 6.6%, below the region-leading Bay State), its private sector has a $15,398 (23.3%) deficit.

New England Average Pay for Public and Private Sector Workers by State, 2010

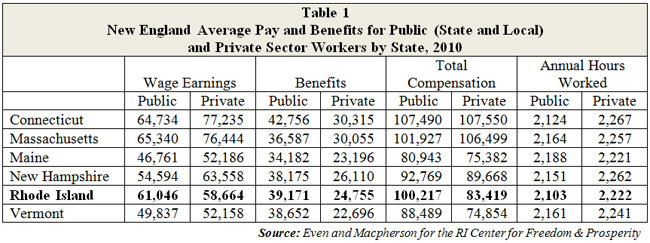
Even when benefits are factored in, the private sectors in Massachusetts and Connecticut outstrip government employees. In contrast, Table 1 shows that Rhode Island adds a relatively large amount of compensation via benefits in its public sector and a relatively low amount in its private sector.

Another significant perk to working in Rhode Island’s public sector is time off. According to the data collected by Even and Macpherson, Rhode Island is the only New England state in which the value of the public sector’s paid time off ($7,208) is greater than the private sector’s ($6,857). (These numbers are included in the total for benefits.)

And while government workers in all New England states put in fewer hours than their private-sector neighbors, Rhode Island’s public employees put in the fewest. Moreover, only in Vermont is the gap between the sectors larger. (Note: Annual hours are calculated from weekly-hour responses on employee surveys.

Variable-Controlled Premiums

A common objection to such comparisons of average pay is that the types of jobs available within the public sector lend themselves to more-highly educated employees. Therefore, the argument goes, it is entirely appropriate for them to make more than the average of all private-sector jobs, because they skew toward the higher end of the workforce.

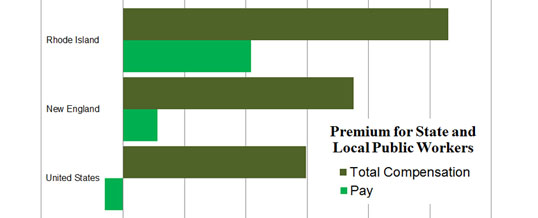
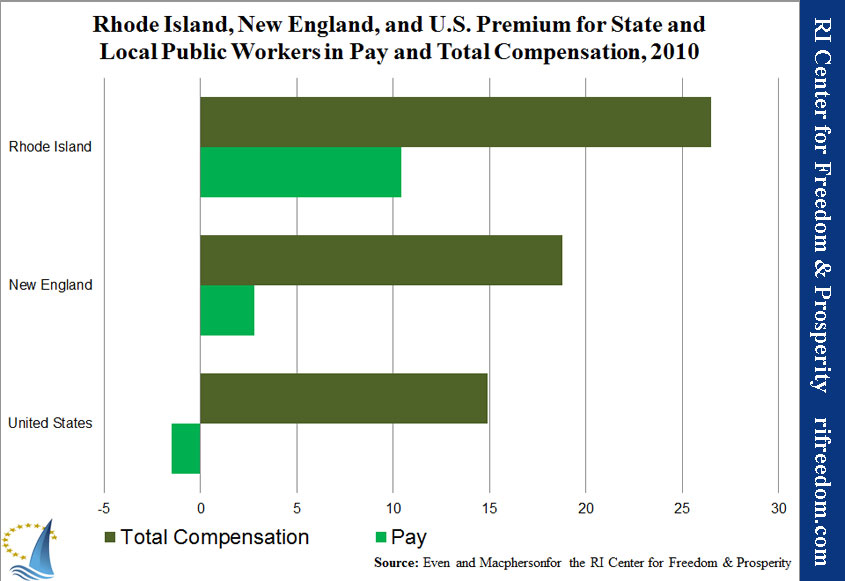
To investigate this explanation, Even and Macpherson performed a regression analysis for Rhode Island, the New England Census division, and the United States in order to compare similarly situated employees. Chart 3 shows a summary of the results.

The percentage shown is the premium for working in the public sector — that is, the percentage advantage in compensation from working in the public sector, taking into account employee characteristics (such as education and experience) as well as broad job category (such as management versus office and administrative support). (See Table 2.)

On salary alone, state and local employees enjoy a 10.4% premium in Rhode Island, even when controlling for other variables like education, experience, and broad job category. For New England overall, the premium is 2.8%. Nationwide, the public-sector actually has a salary penalty of 1.5% below the private sector.

Rhode Island, New England, and U.S. Premium for State and Local Public Workers in Pay and Total Compensation, 2010

Adding in the total value of benefits (before pension reform), Rhode Island’s state and local workers receive a premium of 26.5% over their similarly situated private-sector counterparts. That compares with 18.8% for New England as a whole and 14.9% nationwide.

A significant consideration that Even and Macpherson were unable to quantify due to a lack of data is job security. Given higher rates of unionization and the ability to affect their employers through political activities, government workers are generally understood to face less volatility than do private-sector employees. In theory, economists could apply a monetary value to that intangible benefit, but such an investigation would be beyond the scope of this study.


Pensions & Pension Reform

One important adjustment that Even and Macpherson have made to the raw compensation data is to determine the current value of pension benefits using a 4% discount rate. In a defined-benefit system, actuaries value the guaranteed level of income that employees will receive during retirement by assuming that investments will produce a certain return.

Rhode Island currently assumes a 7.5% return. Prior to the adjustment that spurred the 2011 pension reform at the state level, the assumption was 8.25%. Because this study uses data from 2010, that is the starting point for this data. By comparison, the average private-sector assumption is 6%.

In all cases, therefore, Even and Macpherson had to mark up benefit values to account for the likelihood that investment profits will fall short of predictions. It may seem counterintuitive that a benefit is worth more when invested money receives less profit. However, in the case of guaranteed pensions, the benefit is defined in the future, not the present.

Therefore, lower profits from investments would require greater payments by the employer, making the benefit of greater value to the employee now. In effect, the employer is promising a greater return to the worker than he or she would be able to achieve by investing on his or her own.

Because pensions make up 10-20% of the typical government employee’s total compensation, compared with 4-6% in the private sector, large reforms can greatly affect the premium that public-sector workers receive over the private market-place. For this study to be complete, therefore, some accounting of the effect of the Ocean State’s pension reform on the value of state employees’ benefit packages had to be included.

However, the imposing complexity of pension calculations is such that an accurate estimate of the reform’s effects would be well beyond Even and Macpherson’s scope. In particular, during the transition from the defined benefits pension to the newly developed hybrid plan, each individual employee’s benefit will be different, and results vary from job to job and across state and local governments. It will be a matter of years before accurate data is available.

Consequently, the public-sector premium given above can be considered the outcome if the lawsuit currently pending on behalf of the relevant labor unions succeeds in overturning the reform. For some sense of the result if the state prevails in its defense of the reform, the Center for Freedom & Prosperity asked Even and Macpherson to provide a rough calculation.

It’s important to note, here, that the pension data throughout this study assumes that all municipal employees are receiving the same weighted average contribution as those in the state’s two largest plans — state workers and teachers — with and without 2011’s reform.

Be that as it may, the effect of the reform on this study was relatively minor. The guaranteed payments provided through the defined-benefit portion of the state’s new hybrid pension system have gone down. But the state has increased the percentage of payroll that it must contribute each year, to make up for the 5% of their pay that employees are putting toward their defined-contribution plans. The state has added a 1%-of-payroll contribution to those plans, as well.

Consequently, the annual value of government employees’ pension benefit has only decreased from $10,692 to an estimated $10,476. In terms of the “premium” that state and local workers receive over similarly situated private-sector Rhode Islanders, the percentage advantage has decreased from 26.49% to 26.24%.

Policy Analysis

Living Beyond Our Means

When a family comes to a decision about purchasing any product or service, it doesn’t merely accept the seller’s sense of what’s reasonable. In addition to the market rate, consumers must take into account the quality of the thing they’re buying as well as their own ability to afford it.

With deteriorating infrastructure, doubts about the quality of government services, and the high-profile specter of unfunded municipal and state retirement liabilities looming over the state during this current period of economic stagnation, the compensation of public-sector employees has become a subject of heated debate about fairness and affordability.

Rhode Island is the only state in New England in which public employees have higher base salaries than the private sector. At the same time, state and local workers in the Ocean State work the fewest hours in the region. When benefits are factored in, Rhode Island has the highest premium for public-sector workers over private-sector workers, even if pension reform survives the lawsuit that unions have filed to overthrow it.

Meanwhile, the state’s economy is reeling, with arguably the worst employment picture in the United States, certainly the region. With dwindling taxable incomes and general economic activity, the state and its cities and towns will not long be able to continue to squeeze more revenue from a population that is losing ground economically and seeing many of its productive residents and college graduates flee to states with healthier economies.

Adjustments around the edges that do not take on the significant public policy issues we face will not be sufficient to turn the state around. Without rapid economic growth and a boost to their prosperity, taxpayers’ tolerance and capacity to pay for government beyond their means will continue to wane. Painful struggles between powerful insiders and the average citizen will worsen. Even more taxpayers may decide that the battle is not worth the benefits of living within the Ocean State’s borders.

Economic Growth Benefits Public and Private Sectors

With all of the emphasis on improving economic development in Rhode Island, there have been two conspicuous omissions.

The first is the need for a complete change in the way that state and local governments treat taxpayers and businesses — as a matter of regulation, as a matter of spending, and as a matter of taxation.

The second, as emphasized in the data revealed in this study, is the fact that government workers should be out in front of the crowd advocating for change — not for tax-the-rich schemes that will never produce sufficient revenue, but for precisely the policies founded in economic liberty that will close the gap between private-sector Rhode Island’s earnings and those of its nearest neighbors.

If there is to be any hope of keeping current compensation levels and benefit promises to government workers, the state must experience an immediate boom in the private-sector economy.

Even the dramatic pension reform that sent unions to their lawyers and made state Treasurer Gina Raimondo a national policy star barely nudged Rhode Island’s public sector toward the national ratio of public-to-private workers. It hardly even brought the tiny Ocean State nearer to the average for the union-stronghold region of New England.

While additional compensation cuts and even deeper benefit reforms will be necessary in the public sector, the more significant factor in the public-private imbalance, locally, comes from the substandard economic conditions in which the Rhode Island taxpayer in the private sector is forced to survive. That is where dramatic improvement is most necessary, and most attainable, if public policy can be properly aligned.

Central Falls retirees discovered all too painfully that unsustainable compensation arrangements, whether salaries or benefits, are by no means guaranteed if obvious warning signs are not acted upon responsibly. The comparison of the public sector and the private sector in Rhode Island is one such sign of unsustainable compensation levels.

The people of Rhode Island depend upon government workers for the appropriate and necessary functions of government, but those workers depend upon the private sector to maintain a healthy economy and, in turn, sufficient government revenue. The top priority for employees on both sides of Rhode Island’s taxing and spending, therefore, should be reasonable reform that makes public-employee compensation sustain-able combined with the elimination of policies that restrain economic growth in the Ocean State.

Methodology

Download the PDF version of this report for Even and Macpherson’s full methodology.

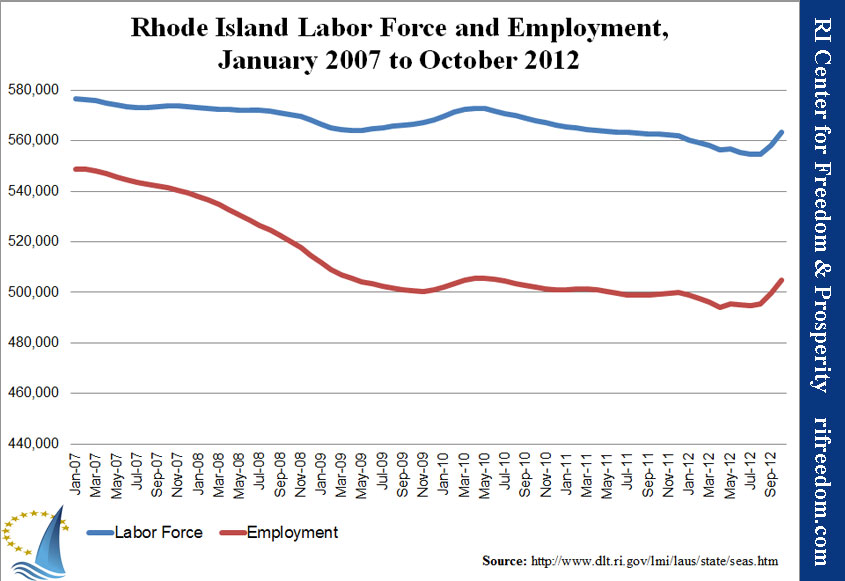
Rhode Island Labor Force and Employment, January 2007 to October 2012

Rhode Island Employment Snapshot, October 2012

Rhode Island’s unemployment rate fell one tenth of a point in October, to 10.4%, still second worst in the nation, after Nevada. However, for the second month in a row, the Ocean State led the nation in actual employment increase. While the data offers an encouraging picture, the boom in jobs over the past two months has been so historically large that it ought to be treated with caution until other economic indicators begin to substantiate the results.

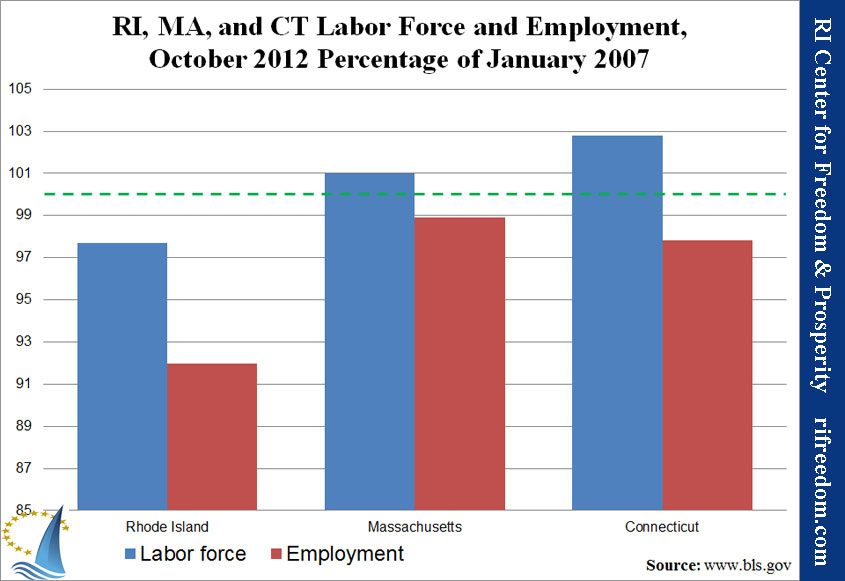
The first chart below shows Rhode Island’s trends in labor force (employed and looking for work) and employment since the beginning of the recession in January 2007. The second chart shows the labor force and employment pictures for Rhode Island, Massachusetts, and Connecticut as each state’s current percentage of January 2007.

Rhode Island Labor Force and Employment, January 2007 to October 2012


RI, MA, and CT Labor Force and Employment, October 2012 Percentage of January 2007

RI’s State and Local Tax Burden Still an F

Rhode Island’s state and local tax burden is still the sixth worst in the nation, according to the Tax Foundation’s updated ranking.  In fiscal year 2010, the latest year for available data, residents of the Ocean State once again paid 10.9% of their income to state and local governments.

As was true last year, using 2009 data, only Connecticut performed worse in New England, by the Tax Foundation’s measure.  Rhode Island’s state and local tax burden will therefore receive another F grade when the RI Center for Freedom & Prosperity updates its Report Card on Rhode Island Competitiveness early in 2013.

In 2010, Rhode Islanders paid $29 less per capita in state and local taxes to other states ($1,309), but $19 more to their own ($3,318).  The Tax Foundation added those sums together and calculated the result as a percentage of the average per capita income of $42,628, which represented an increase of only $155 from the prior year, still well below the 2008 average of $44,345.  More telling, perhaps, is that this increase was much smaller than the norm of the last three decades.

Member of Center’s Task Force to be Panelist at Brown Univ “Pensions in Peril” Forum

Providence — A member of the RI Center for Freedom & Prosperity’s special pension task force will serve as a panelist at the “Pensions in Peril” forum today, October 25 (Thursday afternoon), sponsored by the Taubman Center for Public Policy at Brown University. The forum will feature national and local experts about how municipalities are dealing with the fiscal time bomb of unfunded pension liabilities.

Eileen Norcross, a senior research fellow with the Mercatus Center at George Mason University and lead researcher on the State and Local Policy Project, was the first national expert to raise alarms about public pension accounting in RI localities in 2011, arguing that municipalities are vastly under-estimating the true scope of their unfunded pension liabilities. Norcross co-authored a report that calculated municipal pension liabilities under various discount rate assumptions.

The Mercatus Center report, which received significant local and national attention, indirectly challenges the more rosy pension assumptions put forth by some local officials in RI, including co-panelist, Mayor Scott Avedisian of Warwick.

The forum, which will take place from 4:00 pm to 6:00 pm at the Salomon Center for Teaching 001 off the main green at Brown University, is free and open to the public and media.

For more information about the Center’s pension task force and Eileen Norcross, click here.

The Rhode Island Center for Freedom and Prosperity, a non-partisan public policy think tank, is the state’s leading free-enterprise advocacy organization. With a credo that freedom is indispensable to citizens’ well-being and prosperity, the Center’s mission is to stimulate a rigorous exchange of ideas with the goal of restoring competitiveness to Rhode Island through the advancement of market-based reform solutions.

Media Contact:

Taubman Center: 401.863.2201

Policy Reform: Enact Collective Bargaining Reforms

Up to $250 million per year can be saved in RI


Collective Bargaining Costs

All workers deserve  fair compensation. However, it is not fair that taxpayers, struggling in a poor state economy, must also be forced to pay for excessively high compensation packages for unionized government workers. With reforms to collective bargaining, undue union influence and election cronyism can be reduced.

The ever-increasing total cost of employment for unionized government labor — annual  compensation plus benefits — is a cost item we simply can no longer afford.

It’s time to face the facts: public-sector unions drain precious resources away from Rhode Island’s sick, elderly, youth, and poor.

See “Collective Bargaining Reform” policy brief …


Policy Reform: Require Accuracy In Pension Accounting


Municipalities are understating the true cost of unfunded pension liabilities

Government employees need to properly plan for their retirements. Municipal officials need to have predictable budgets from which to provide quality education and city services. Taxpayers need to know that budget shortfalls will not raise their property taxes. Before local pension funding formulas can be effectively developed, it is essential that Accuracy in Pension Accounting be required of all municipalities.

The assumed rate of return that most government entities have traditionally used to estimate pension liabilities has been widely discredited as overly optimistic. A more conservative market rate, similar to what is used in the private sector, is generally seen as a more accurate measurement.

When a private company, like Enron, used improper accounting practices, the wrong-doers ended up in jail. When our local governments understate pension liabilities, retirement plans are put at risk, our schools suffer, local services are cut, and taxpayers pay more from their pockets.

At an October 2012 pension forum state and local officials openly admitted that it would be politically inconvenient to disclose the true scope of the problem to their constituencies.

This can all change with accurate accounting.

Read more about our “Truth in Pension Accounting” movement here … 


North Kingstown Employees Strike to Maintain Public-Sector Premium

One question lost in the heat of this school year’s example of the annual opening-day labor dispute is: Why should school children pay more for janitorial services than anybody else would?  The practical answer is that parents are very sensitive to the treatment of their children, and that’s just one of the points of leverage that public-sector unions have.

According to the North East Independent, writing in July, janitors in North Kingstown used to make $19.47 per hour. Since the school committee voted to switch from the in-house union to the private GCA Services Group, while keeping the same workers, that hourly rate has fallen to $15.17. That’s a substantial drop of 22%, and it comes with greatly inferior benefits.  But in Rhode Island’s continuing jobs recession and apparent economic decline,  it isn’t clear that public-sector jobs, especially in schools, ought to be notably inviolable.

Data from the U.S. Bureau of Labor Statistics, last compiled in May 2011, shows the median hourly wage for “janitors and cleaners, except maids and housekeeping cleaners” in Rhode Island at $11.82. The average wage is $13.03, indicating that a small number of janitors make much more than that.  Despite the substantial cut, the North Kingstown crew is still among those high-wage outliers.

In this regard, the North Kingstown School Department is merely providing the latest example of a fact that the RI Center for Freedom & Prosperity highlighted in January: public-sector unions drive labor costs well above the market rate. The Center cited a study by the Goldwater Institute finding that a ban on collective bargaining and contracts in the public sector could save the state $252 million.  Keep in mind that this total is state workers only.

Goldwater found that, overall, the nationwide premium that taxpayers pay for the workers under their employ is 44% over the private sector.  Before the North Kingstown School Committee’s action, this summer, the janitors on its payroll were well above even that.

Dept. of Education School Report Cards Should Be Reviewed in Context

As part of its accountability initiative — ultimately relating back to President George W. Bush’s No Child Left Behind Act — the Rhode Island Department of Education (RIDE) has compiled report cards for every public school in Rhode Island. In the spring, the department released its scores and rankings for schools teaching different grade levels, and the public is in the process of figuring out how to apply them to the civic debate.

According to RIDE’s fact sheet for its accountability system, elementary and middle schools achieve their scores based on the following categories:

  • 30 points for proficiency: Averaging reading and math scores, what percentage of students are “proficient” on the New England Common Assessment Program (NECAP) tests?
  • 5 points for distinction: Averaging reading and math, what percentage of students are “proficient with distinction” (i.e., highly proficient) on the NECAPs?
  • 30 points for gap-closing: Combining ethnic and economic categories into one group and special education and English-language learners into another, how much of a gap is there between such students’ scores and those of students not in either?
  • 10 points for progress: Does the school appear to be on track for targets set by RIDE for 2017?
  • 25 points for growth: Are students progressing from one year to the next compared with their academic peers? This measure also breaks students into three groups: “all students” and the groups described in “gap-closing.”

A conspicuous shortcoming of this methodology is that it effectively gives extra credit to schools that don’t have subgroups to compare for gap-closing purposes.  If a school doesn’t have a certain number of minority, English-language learner, special education, or economically disadvantaged students, those categories simply don’t count in the average, and the school gets 30 points toward its total.  That’s potentially the difference between “commended” and “typical.”

A review of the report cards for the 17 commended schools shows that nearly one in four has no subgroups at all — four of them, or 23.5%. Another 10 (58.8%) only have enough students in the “economically disadvantaged” category to count, and just three (17.6%) have data in the disability category.  (See here for all schools’ scores.)

A closer look at “economic disadvantage” is justified. That category is defined by participation in the National School Lunch Program, by which the federal government subsidizes meals for school children.  All students can participate, but those from households above 185% of the federal poverty level (FPL) pay a “regular price.”  In Rhode Island, 60% of participants receive reduced prices or free lunches.

For RIDE’s assessment purposes, however, the wide range in circumstances covered by this program should be acknowledged.  For a family of two parents and one child, 185% of FPL is income of $35,316.50. The same family with another child could make up to $42,642.50, and a two-parent, three-child household could earn up to $49,968.50 and still count as “economically disadvantaged.”

It doesn’t detract from the difficulty that such families can face to suggest that there’s quite a difference between growing up at the top of that scale and growing up in the grinding poverty more common in urban areas.

For context, consider the 17 schools at the bottom of RIDE’s ranking: all but one have scores for either black or Hispanic students; 11 count both. Fourteen schools (82.4%)  have enough students with disabilities to count.  Seven (41.2%) count English-language learners.  And every single one of them (100.0%) has economically disadvantaged students.

Click here for elaboration and context.

Policy Reform: Eliminate the Sales Tax

.
Rhode Islanders want more financial security and control over their own lives. Increased job opportunities, higher wages, and enhanced job security can all be achieved in a robust economy.

Phase out or immediately eliminate the sales tax. This tax reform policy will produce an immediate boost to the RI economy and will produce more jobs than any other solution on the table, creating 20,000+ new jobs in the Ocean State!

Imagine the renewed sense of security you and your children will feel, knowing that there are more career opportunities to choose from and knowing that your employer is more likely to remain in business, as well as the opportunity to earn higher wages in a more competitive economy.

View the Zero.Zero report here …

Visit the Zero.Zero home page here …

75-38-400  or  68-0.0-5000 ?

Consider the $75 million the state wasted on 38 Studios, chasing after just 400 jobs. Compare that with first year budget cuts of $68 million to pay for Zero.Zero, producing 5,000 jobs that year alone!


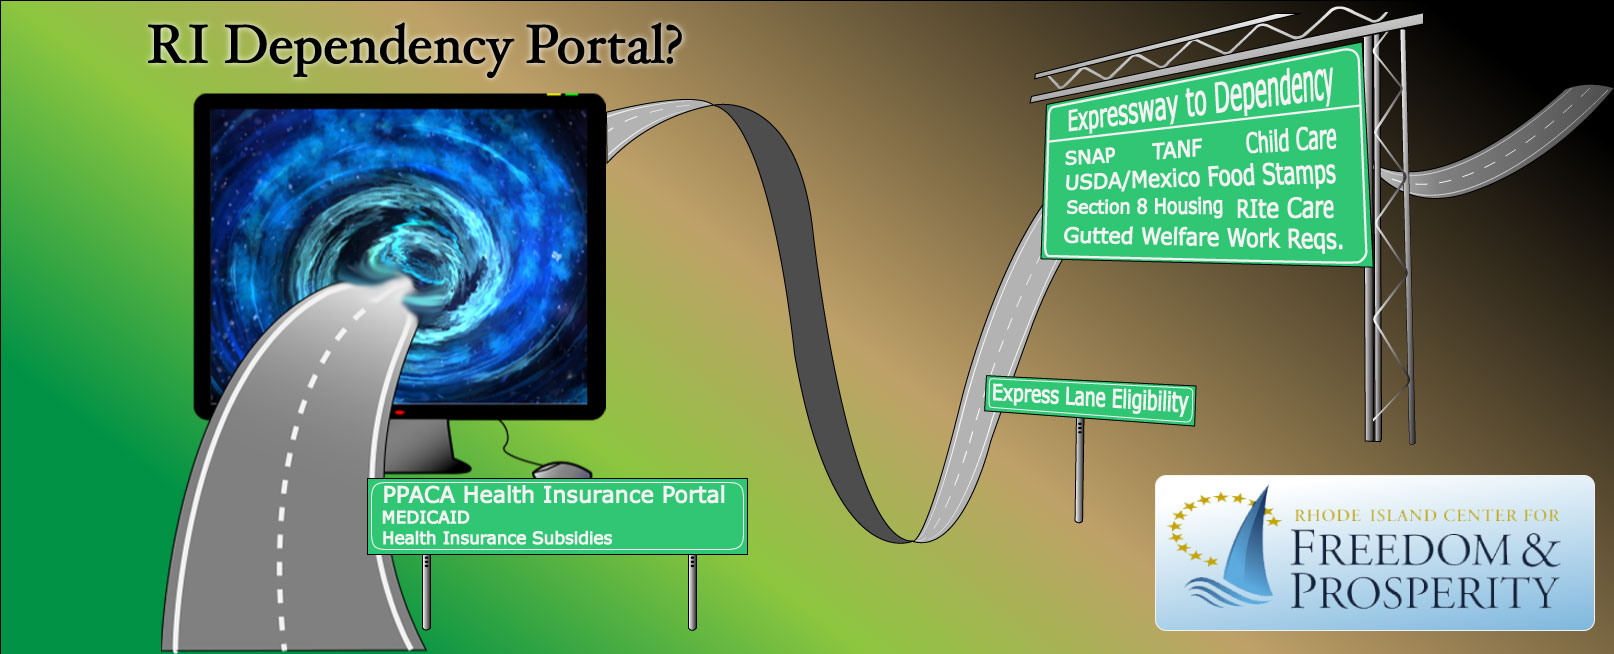
R.I. Creating an Expressway to Dependency

The Issue. Rhode Island is leading the nation in the advancement of a larger entitlement culture via its planned expansion of social services through a health benefits exchange, a component of the controversial federal healthcare law. When collecting detailed personal financial and household information from individuals seeking health insurance support, the state intends to proactively enroll participants in other state programs for which they are eligible. Will this create and expanded culture of dependency?

Statement from CEO, Mike Stenhouse. “This is an extreme case of misguided public policy. The expansion of government and special interest control over our personal healthcare decisions, along with the culture of dependency being freely advocated by this administration, should be viewed as an assault on our deeply held American value of self-reliance.

“Imagine turning to the RI health benefits portal because your employer cancelled your insurance and finding yourself on a government-created expressway to a life of dependency. Wouldn’t we all be better off, instead, if the state encouraged residents to become independent, productive members of society?”

Related LinksMike Stenhouse discusses the ‘Dependency Portal’ on the Helen Glover radio show … click hereDependency Portal Pieces in Place;

What the Center is calling a “dependency portal.”  The dependency portal is a not-so-hidden goal of Rhode Island’s version of the health benefits exchanges described in the Patient Protection and Affordable Care Act (PPACA, commonly known as ObamaCare).

Although the final design has not been developed in specific detail, the idea of the exchanges is to enable healthcare consumers to use a government Web site to review their available options for insurance and to determine their eligibility for public subsidies.  Most likely, a series of Web-based forms will ask the user for a variety of highly personal information regarding health, income, and family circumstances in order to determine what health plans and public assistance amounts he or she is eligible for.

Whether such information will be requested of all residents who seek to use the site or only of those explicitly seeking subsidies remains an open question.

The exchange will become a dependency portal when other forms of public assistance — from food stamps to cash-payment welfare to child-care subsidies — are integrated into the system and promoted to the exchange user based on information that he or she provides while seeking health coverage — perhaps automatically enrolling people with the merest expression of consent.

At a recent press conference, Rhode Island Health and Human Services Secretary Steven Costantino referred to this “hidden element” of the exchanges as “one-stop shopping.”

Why is that bad? As a free market think tank, the Center is certainly not opposed to practices that encourage efficiency and the use of technology to improve the access that customers and clients have to services. Information technology, in particular, has empowered individuals to accomplish easily and inexpensively tasks that once required expert consultants.

From a business perspective, the Internet and the proliferating technologies that use it, now including smartphones and tablets, smooth the path from a potential customer’s initial interest all the way to final purchase.  Technology enhances businesses’ ability to market and sell their products and services, and they seek to accomplish those ends in order to grow their revenue and expand their market share.

That model is not appropriate to government in dispensing taxpayer-funded services.

In the private sector, bundling of services has become commonplace, and it is easy to understand why companies would pursue the strategy.  Think of the merging technologies of television, Internet, and telephone; it makes sense for a company with an advantage in, say, television, to use various marketing techniques, such as reduced-price packages, cross advertising, and one-stop shopping, to gain an edge in other markets.

However, the public clearly has a sense that these methods can go too far.  Indeed, at the turn of the millennium, the federal government sued Microsoft on the grounds that it was hindering competition by using its operating system dominance (with Windows) to gain an insurmountable advantage in the Web browser market (with Internet Explorer).

In the case of government, all of the same incentives exist for the organization to expand its reach.  The difference is that government has three inherent competitive advantages:

  1. In its ability to simply confiscate money to pay for, or at least subsidize, its services
  2. In the fact that the people whom it entices to its services are not paying their full cost
  3. In its control of the marketplace by means of regulation

Over time, government programs are therefore less and less “public services” that taxpayers agree to support through the people whom they elect and more and more bureaucratic offerings that use the enrollment of some citizens as justification for claiming more authority and confiscating more money from others.

One can see evidence of this intention in the process by which Rhode Island’s exchange was initiated.  In the face of (to be mild) public uncertainty about the PPACA, the Democrat president and Congress pushed it through.  It creates financial incentive for states to build the exchanges (by making taxpayers from other states pay for it), and it hands an astonishing amount of policy discretion to the unelected Secretary of Health and Human Services.

In Rhode Island, Governor Lincoln Chafee broke with common understanding of separation of powers in order to create the exchange by means of executive order, committing the state to pay for the site’s maintenance once it is operational.  Similarly, the state executive branch has simply determined to agree to a related Medicaid waiver, expanding free healthcare services in the state and adding to its expenses.  No legislative input; no public hearings; in short, no public statement of agreement with the programs being developed in the people’s name.

As the government exchanges claim increasing shares of the market nationally, unelected state and federal officers will be authorized to determine everything from minimum benefits to price controls to payment schedules.  The board that Governor Chafee appointed to initiate the exchange illustrates that special interests will have an outsized role, as well.

With the addition of other welfare programs to the mix, it will be even more difficult for the people of the state to change course.

What it means for you. Losing control of activities done in the public’s name may not be the most dire consequence of the dependency portal approach.  Rather, the fatal part of the trap is the fast lane to a culture of universal reliance on government and a pervasive sense of entitlement.

Whenever the topic of welfare arises, conversation turns toward those who “know how to work the system” and thus become the fabled “welfare queens.”  For them, incentives toward good behavior have been reduced or reversed, and democracy has devolved into an exchange of political power for handouts.

The real danger of the dependency portal is that it sets up a chute so that previously self-reliant Rhode Islanders will increasingly fall into an entitlement existence.  Why else would the exchanges offer health care subsidies to a family of four with income of $92,200?

Just as technology has simplified tasks that once required expert consultants, the dependency portal will make “working the system” a simple matter of clicking a few buttons.

Tracing the progress of the portal in Rhode Island. RI Health & Human Services Secretary Steven Costantino, Health Benefits Exchange Director Christine Ferguson, and Lt. Governor Elizabeth Roberts describe Rhode Island’s nation-leading steps toward the dependency portal (June 28, 2012):


Elaboration on why Rhode Island and the United States should resist the pull toward dependency portals:

RI Center for Freedom & Prosperity first identifies the dependency-portal dynamic as one reason to reject the health benefit exchange and the Medicaid expansion:

The pieces needed to turn the exchange into a dependency portal are being put into place:

RI officials acknowledge intention to implement Medicaid expansion, without any indication of legislative or public input:

Documents related to the dependency portal begin to reveal the direct connection between those pushing the concept and those involved with Rhode Island’s health benefits exchange:

The dependency portal in concert with eliminated work requirements for welfare may mark the return of the “welfare queen” and a “majority coalition” for big-government activists:

Documents. The federal government and national non-profits describe the dependency portal and the related “express lane eligibility”: