RIVotes.org

RIVotes.com now live! Transparency to hold your Legislator Accountable

Go to RIVotes.com

October 2, 2012: The non-partisan Rhode Island Center for Freedom and Prosperity announced today the launch of RIVotes.com, an online transparency tool that allows the public easy access to the voting records of state legislators as well as the capacity to search for and track pieces of legislation in the most comprehensive manner available during the legislative session.

RIVotes.com is designed to help community leaders, businesspersons, newspersons, public officials, and members of the general public understand how their legislators voted on bills that affect their communities, businesses, schools, or families. This transparency and accountability website allows citizens take a more active part in the democratic process.

The Center recently added 2012 bills into RIVotes.com, which also includes legislation as far back as 2009. RIVotes.com features a host of user-friendly functions, including:

  • View the voting record of any legislator by all bills, by category, or by date range.
  • Easily create a “Missed Votes” or a “Voted Against Majority of own Party” report.
  • Find bills of specific interested, with searches by topic, keyword, date range, or bill number.
  • Build your own custom “scorecard”: choose the bills to include and the “correct” vote; RIVotes.com automatically creates a legislator-by-legislator scorecard.
  • Interactive discussion forums and social media integration to allow you to join with other citizens in posting comments and initiating viral distribution.
  • Sign up for automatic email notification when action is taken on bills that interest you.

“Combined with our recently released General Assembly Freedom Index, our Center is providing unprecedented transparency to citizens about the voting histories of their state Senators and Representatives,” said Mike Stenhouse, CEO for the Center. “In order to protect our free and democratic society, citizens must remain well informed about what their government is doing and must hold their legislators accountable for how they vote,” added Stenhouse.

The RI Center for Freedom & Prosperity also plans to utilize a new feature of RIVotes.com to automatically send out regular voting summaries to local media entities and to interested taxpayer groups during the 2013 legislative session.

RIVotes.com is the second transparency website launched by the Center: RIOpenGov.org was launched in 2011 to provide detailed pension payment data for state and municipal employees. RIVotes.com is a copyrighted product of the Mackinac Center for Public Policy.

The Rhode Island Center for Freedom and Prosperity, a non-partisan public policy think tank, is the state’s leading free-enterprise advocacy organization. With a credo that freedom is indispensable to citizens’ well-being and prosperity, the Center’s mission is to stimulate a rigorous exchange of ideas with the goal of restoring competitiveness to Rhode Island through the advancement of market-based reform solutions.

WATCH: Mike Stenhouse discusses “What’s a Citizen to Do?” on State of the State TV

Center Hosts ATLAS SHRUGGED 2 Movie Premiere Event

Ayn Rand fans gather with the Center's staff

The RI Center for Freedom and Prosperity invites friends of the Center and all free-enterprise loving citizens to the world premiere movie showing at the Lincoln Cinema World on Friday, October 12, 2012 at approximately 7:00 pm.

For a small, tax-deductible donation to the Center, registrants receive a movie ticket and FREE Atlas Shrugged II bonus items including an XL T-Shirt, and a raffle ticket for a drawing for posters, mug, and cap. Upgrade packages also offered.

Support our Center!

Click here for the event home page and to REGISTER for the event!

Rhode Island Employment Snapshot, August 2012

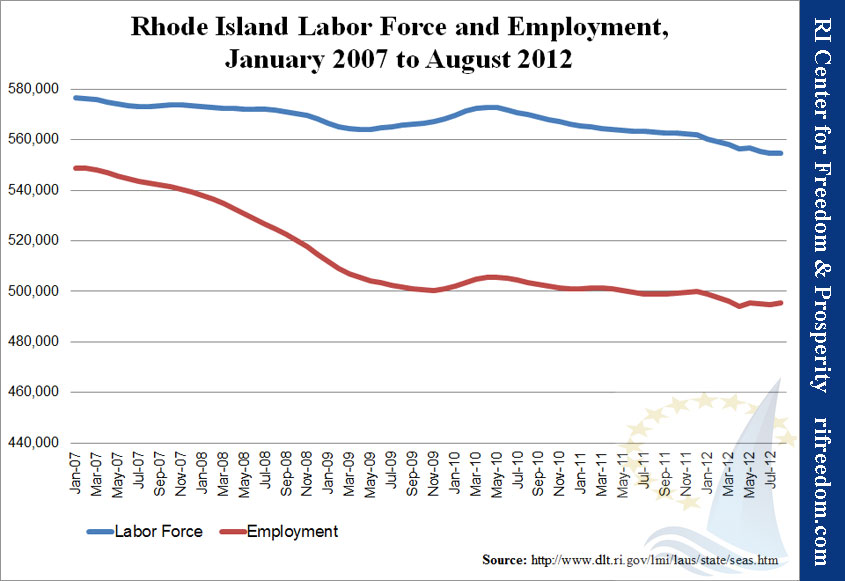
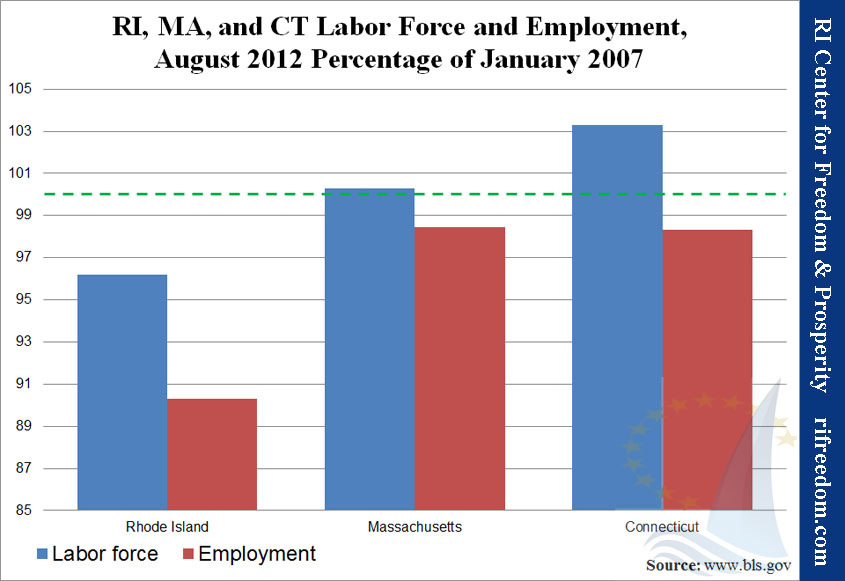
Rhode Island’s unemployment rate fell a tenth of a point in August, to 10.7%, still second only to Nevada.  This month, the results could be termed “mixed,” but it’s a mix of bad and stagnant.  Employment actually increased, after a summer of losses, but even more gave up looking for work.

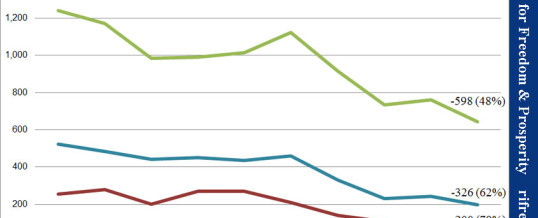
The first chart below shows the trends in labor force (employed and looking for work) and employment since the beginning of the recession in January 2007.  The second chart shows the labor force and employment pictures for Rhode Island, Massachusetts, and Connecticut as each state’s current percentage of January 2007.

Rhode Island Labor Force and Employment, January 2007 to August 2012


RI, MA, and CT Labor Force and Employment, August 2012 Percentage of January 2007

Medial Release: First Annual General Assembly Freedom Index

A Legislative Scorecard for Rhode Islanders

View all information about the Freedom Index here …

FOR IMMEDIATE RELEASE: September 20, 2012

The non-partisan Rhode Island Center for Freedom and Prosperity published today its first annual General Assembly Freedom Index, which ranks Ocean State lawmakers on their level of support of principles of freedom during the 2012 legislative session.

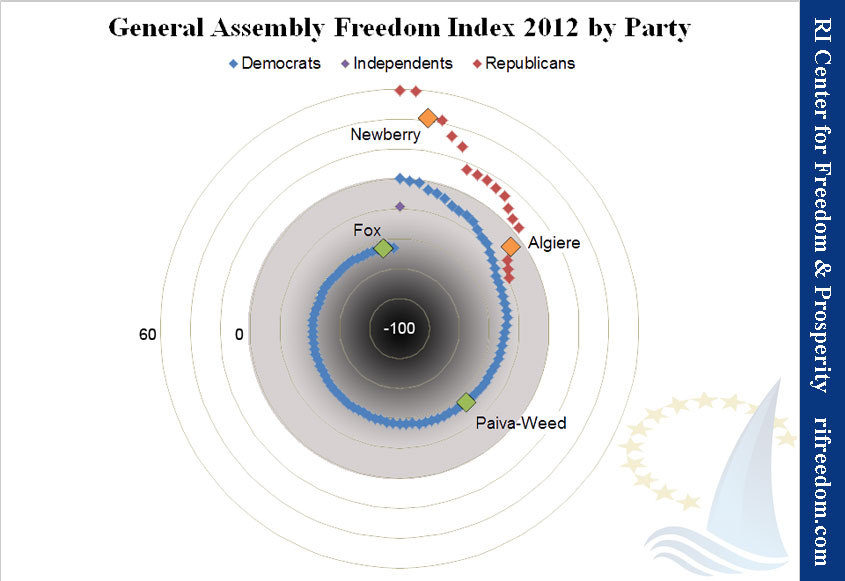
“It is clear that the undesirable -25.4 Freedom Index for the entire General Assembly means that significantly more votes undermined freedom than preserved it and that, in our state, citizens have fewer liberties today than a year ago,” said Mike Stenhouse, CEO for the RI Center for Freedom & Prosperity. The House of Representatives scored -24.1, with House Democrats at -32.2 and Republicans at +28.8. The Senate scored -27.9, with Senate Democrats at -36.3, Republicans at +1.0, and the lone independent at -18.3.

“We believe freedom is necessary for prosperity. It’s all too common for legislators to trade the intent of a bill for an infringement on our liberties – and this practice must stop,” continued Stenhouse. “This index provides important transparency for citizens and raises some compelling questions: Will voters accept this continued loss of liberty and hold their elected officials accountable? How much will voting records become a campaign issue this fall?”

Per the index, the highest ranked lawmaker in the whole General Assembly in 2012 was Representative Doreen Costa, a Republican from District 31, who achieved a score of +59.2. The top-ranked Democrat was Representative Peter Palumbo, District 16, who scored at +0.5 and was the only member of his party above zero. Ninety-eight (98) of the one-hundred and thirteen (113) legislators earned a negative index score.

In total, 96 legislative bills that received a floor vote were selected for evaluation; bills that were deemed to have a positive or negative effect on individual or economic liberty. The bills were then weighted by their perceived impact from -3 to +3. Depending on how legislators actually voted on each bill, they received positive or negative scores for each vote in the amount of the weighting. Dividing his or her total the score for all of the bills evaluated by the ideal score for the relevant chamber determined each legislator’s Freedom Index score.

The bills evaluated were divided into five categories: Tax & Budget, Regulatory Environment, Constitutional Government, Public Sector Labor, and Education Reform.

Other findings include;

* Overall Democrat Index of -33.5

* Overall Republican Index of +16.5

* Overall Regulatory Environment Index of -49.0

* Overall Tax & Budget Index of -26.0

* Overall Public Sector Labor Index of +16.7

Additional information is available on the Center’s Web site, including multiple tables, charts, breakdowns by category, criteria, and a methodology description, as well as links to a PDF of the scorecard and a legislator-by-legislator breakdown of each bill evaluated in the 2012 index, including category rankings and bill descriptions.

The Freedom Index score generated for each legislator is a direct reflection of the perspective of the RI Center for Freedom & Prosperity when it comes to the weighting of each bill. The Freedom Index is not an absolute measure of a legislator’s merit and does not constitute any endorsement or criticism. The Freedom Index is a tool designed for general research and for accountability, helping voters make their own assessment of the body of work of their elected legislators.

The Rhode Island Center for Freedom and Prosperity, a non-partisan public policy think tank, is the state’s leading free-enterprise advocacy organization. With a credo that freedom is indispensable to citizens’ well-being and prosperity, the Center’s mission is to stimulate a rigorous exchange of ideas with the goal of restoring competitiveness to Rhode Island through the advancement of market-based reform solutions.

RI General Assembly Freedom Index

Download: Freedom Index 2012 Scorecard; legislator votes, bill explanations, and rankings ; Click here for the Media Release

Radio:  Stenhouse discusses Index on Dan Yorke radio show ; and on the Helen Glover show (@ the 13:00 minute mark)

The first-annual General Assembly Freedom Index by the RI Center for Freedom & Prosperity scores Ocean State lawmakers on their level of support for principles of freedom as proven by their votes on the floors of the House and Senate.

The index examines legislators’ votes in terms of their likely effect on the free market, the size and scope of government, the balance of residents’ interests against those of public employees and beneficiaries, and the constitutional structure of a divided government with limited power over the people whom it represents. The Center reviewed every bill that received a roll-call vote by the full membership of either chamber and selected 96 that fit its understanding of these criteria. (Companion bills only count once.)

The resulting scores give a detailed sense of each legislator’s priorities beyond a few high-profile issues.

The Center further divided the bills into five categories:

  • Tax & budget:  bills that affect the tax structure in Rhode Island and/or that relate to government expenditures, just driving or relieving the pressure on taxation
  • Regulatory environment: bills that make it more or less difficult to live and do business in the state by imposing regulations
  • Constitutional government: bills that affect the structure of the government, as well as the scope of government in its authority over residents’ lives
  • Public sector labor: bills related to the relationship between its employees and itself and the electorate
  • Education reform: bills that advance or impede the reform of the state’s public education system, in terms of both cost and quality

Most legislation has implications for more than one of these categories.  For the purposes of this index, we applied our subjective sense of the area of core effect and sorted the bills accordingly.  If, for example, a bill having to do with education seemed to us intended to secure the role of public employees, we classified that bill as Public Sector Labor, not Education Reform.

Download: Freedom Index 2012 Scorecardlegislator votes, bill explanations, and rankings

2012 Freedom Index Findings

Ninety-six (96) different pieces of legislation (counting companion bills once) were evaluated.  The Center judged 70 of them as having a negative effect on freedom.

The average legislator index score of -25.4 indicates that the General Assembly moved Rhode Island in the wrong direction, and that Rhode Islanders are less free than they were in 2011. This index underscores our Center’s view that the 2012 RI General Assembly did not positively address the dire business climate of our state.

Top and Bottom 10

House Senate
Top 10 Bottom 10 Top 10 Bottom 10
1 Costa 59.2 113 Bennett -46.0 1 Kettle 15.5 113 Tassoni -44.8
2 Gordon 58.7 112 Fox -45.3 2 Shibley 14.0 112 Lanzi -44.8
3 Newberry 42.0 111 Ajello -45.3 3 Moura 8.6 111 DaPonte -43.1
4 Chippendale 41.7 110 McNamara -45.3 4 Hodgson 5.2 110 Miller -42.0
5 Watson 33.5 109 Valencia -45.3 5 Maher 4.1 109 Lynch -42.0
6 Trillo 28.8 108 Blazejewski -45.3 6 Algiere -7.8 108 Perry -41.6
7 Morgan 15.3 107 Cimini -45.3 7 Pinga -12.1 107 Ruggerio -41.4
8 Ehrhardt 15.1 106 Silva -45.3 8 Bates -14.7 106 Goodwin -41.4
9 Reilly 13.2 105 Mattiello -44.6 9 Ottiano -17.0 105 McCaffrey -41.4
10 Palumbo 0.5 104 Ucci -44.6 10 Cote -17.7 104 Fogarty -41.4


General Assembly Freedom Index 2012 by Party


Other findings include;

  • Average House index of -24.1
  • Average Senate index of -27.9
  • Average Democrat index of -33.5
  • Average Republican index of 16.5
  • Average Regulatory Environment index of -49.0
  • Average Tax & Budget index of -26.0
  • Average Constitutional Government index of -9.1
  • Average Public Sector Labor index of 16.7
  • No bills directly related to Education Reform were scored in this index
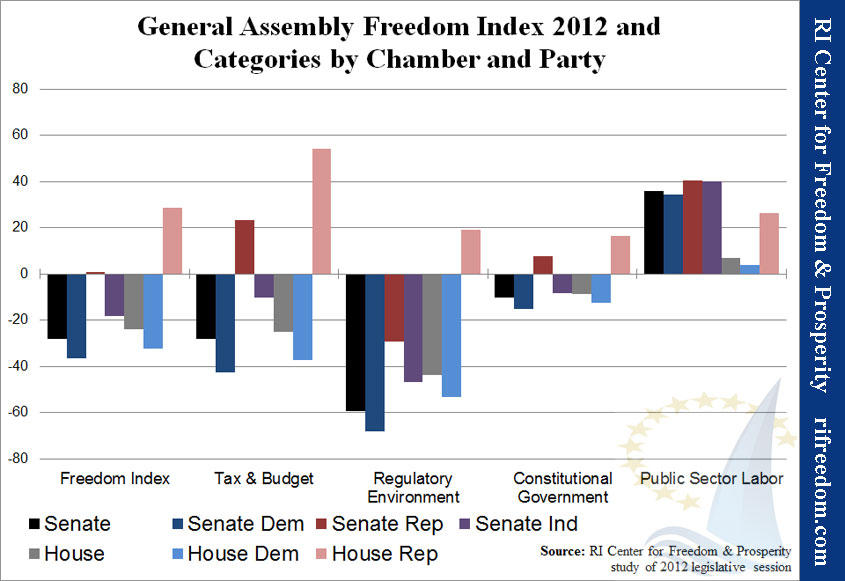
 

General Assembly Freedom Index 2012 and Category by Chamber and Party


Tax & Budget Category, Top and Bottom 10

House Senate
Top 10 Bottom 10 Top 10 Bottom 10
1 Newberry 68.8 75 Silva -67.2 1 Kettle 44.8 38 Pichardo -59.5
2 Chippendale 68.8 74 Bennett -62.5 2 Shibley 44.8 37 Lynch -54.3
3 Watson 68.0 73 Fox -62.5 3 Hodgson 44.8 36 Crowley -54.3
4 Trillo 67.2 72 Ajello -62.5 4 Moura 31.0 35 Tassoni -51.7
5 Costa 66.4 71 McNamara -62.5 5 Maher 24.1 34 Lanzi -51.7
6 Gordon 66.4 70 Valencia -62.5 6 Algiere 17.2 33 DaPonte -51.7
7 DaSilva 54.7 69 Blazejewski -62.5 7 Felag 10.3 32 Miller -51.7
8 Morgan 43.8 68 Cimini -62.5 8 Pinga 10.3 31 Perry -51.7
9 Reilly 43.8 67 Mattiello -62.5 9 Bates 10.3 30 Ruggerio -51.7
10 Lima 43.8 66 Ucci -62.5 10 Ottiano 10.3 29 Goodwin -51.7


Regulatory Environment Category, Top and Bottom 10

House Senate
Top 10 Bottom 10 Top 10 Bottom 10
1 Gordon 66.9 75 Mattiello -66.9 1 Hodgson -18.0 38 Miller -76.3
2 Costa 55.2 74 Tarro -66.9 2 Kettle -23.1 37 Tassoni -74.4
3 Watson 52.2 73 Naughton -66.9 3 Shibley  -23.1 36 Lanzi -74.4
4 Chippendale 27.2 72 Corvese -66.9 4 Moura   -23.1 35 Lynch -74.4
5 Newberry 23.5 71 Bennett -64.7 5 Maher -31.4 34 Perry -74.4
6 Trillo 17.6 70 Fox -64.7 6 Bates -33.3 33 Ruggerio -74.4
7 Ehrhardt  15.4 69 Ajello -64.7 7 Algiere  -35.9 32 Goodwin -74.4
8 Reilly 0.0 68 McNamara -64.7 8 Pinga -41.7 31 McCaffrey -74.4
9 Morgan -7.4 67 Valencia -64.7 9 Lombardo -43.0 30 Fogarty -74.4
10 MacBeth   -7.4 66 Blazejewski -64.7 10 Cote -43.6 29 Sosnowski -74.4


Constitutional Government Category, Top and Bottom 10

House Senate
Top 10 Bottom 10 Top 10 Bottom 10
1 Costa 61.2 75 Hearn -31.0 1 Kettle 29.7 38 DaPonte -29.1
2 Gordon 38.8 74 Jacquard -25.0 2 Shibley 24.3 37 Perry -19.6
3 Chippendale 36.2 73 MacBeth -22.4 3 Moura 18.9 36 Tassoni -18.9
4 Newberry 32.8 72 Bennett -19.8 4 Maher 18.9 35 Lanzi -18.9
5 Morgan 12.9 71 Hull -19.0 5 Pinga 6.1 34 Miller -18.9
6 Palumbo 6.0 70 Fox -17.2 6 Cote 6.1 33 Lynch -18.9
7 Flaherty 6.0 69 Ajello -17.2 7 Sheehan -2.0 32 Ruggerio -18.9
8 DeSimone 5.2 68 McNamara -17.2 8 Ottiano -4.1 31 Goodwin -18.9
9 Trillo 4.3 67 Valencia -17.2 9 Hodgson -8.1 30 McCaffrey -18.9
10 Schadone 3.5 66 Blazejewski -17.2 10 Algiere -8.1 29 Fogarty -18.9
(Note: Insufficient votes were cast in the Education Reform and Public Sector Labor categories for meaningful comparisons.)

Index Overview

The Center selected legislative bills for inclusion in the Freedom Index if they were deemed to have an effect on free-market, small-government, or constitutional principles, with each bill assigned a positive or negative weighting based on the criteria listed below. Weighted points for each bill were given to each legislator based on his or her roll-call vote on it.

Each legislator’s final Freedom Index was calculated as his or her score’s percentage of the total possible points. A positive score indicates a 2012 voting record that generally protected individual and economic freedoms, while a negative score reflects the opposite.

Disclaimer: It should be noted that the total Freedom Index score generated for each legislator is a direct reflection of the perspective of the RI Center for Freedom & Prosperity when it comes to the weighting of each bill. The Freedom Index is not an absolute measure of a legislator’s merit and does not constitute any endorsement or individual criticism. The Freedom Index is a tool designed for general research and for accountability, giving voters some quantitative metrics for their own assessments as to their elected legislators’ performance. 

Methodology

1) Determine weighting: Each selected bill received a weight ranging from +3 to -3, as determined by the RI Center for Freedom & Prosperity. Negative weights indicate legislation that creates or expands an agency, government program/function, or tax; creates new regulatory burdens; is hostile to constitutional principles; or otherwise conflicts with the principles that guide the Center. Positive factors were assigned to bills in line with those principles. Companion bills in the House and Senate were weighted identically. To determine the weightings, the Center requested reviews of all chosen legislation from a half dozen engaged Rhode Islanders with similar principles and combined the range of results for a final weighting.

2) Determine vote: Each legislator received a +1 or -1 vote factor, depending on whether he or she voted FOR or AGAINST a particular bill, respectively. If a legislator did not vote on a bill, he or she received a +0.25 if the bill passed or a -0.25 if the bill failed. Legislators who abstained from voting received a +0.75 or a -0.75 vote factor depending on if the bill passed or failed.

3) Calculate weighted vote: Multiplying the weighting factor and the vote factor produced a weighted vote score for each legislator for each bill.

4) Calculate the legislator score:  The cumulative score for all bills for each legislator determined that legislator’s overall score.

5) Calculate Freedom Index: Dividing each legislator’s total score by the maximum possible for the appropriate chamber provided his or her Freedom Index, or a percentage of the best possible score he or she could have achieved. In 2012, the “perfect” scores are 106 for the House and 116 for the Senate.

For example, consider a bill that would increase the regulatory burden significantly in Rhode Island and that the Center therefore weighted as a -2. Legislator A voted for the bill. His or her weighted vote would be calculated as follows: -2 x 1 = -2. Conversely, the weighted vote for Legislator B, who voted against the bill, would be: -2 x -1 = 2.

If Legislator A, in the House chamber, earned a total legislator score of -33, his or her Freedom Index would be calculated as: -33 ÷ 106 x 100 =  -31.1.  If Legislator B in the Senate had a total score of +23, his or her Freedom Index would be calculated as: 23 ÷ 116 x 100 = 19.8.

To rank the legislators, the Center sorted them by their Freedom Index scores and then, in the cases of ties, by their scores in each category, in the following order: Regulatory Environment, Tax & Budget, Constitutional Government, Public Sector Labor, and Education Reform. When legislators’ results were still identical, the Center adjusted them in order of their apparent stature and power within their chambers.

Criteria

In determining each bill’s weighting, the following questions were considered:

  • Does the bill create or eliminate an agency, program, or function of government?
  • Does it give the government new or expanded power to prohibit or restrict activities in the free market? Examples may include licensure and other restrictions on legal business practices.
  • Is it unconstitutional or does it do violence to our concepts of federalism or separation of powers? Does it restrict property, speech, gun, or other constitutionally recognized rights or freedoms? Conversely, does it restore balance between the state and federal government, resume state authority over an issue under the 10th Amendment, or remove restrictions on constitutionally protected rights?

Other considerations were also brought into question:

  • Does the bill redistribute wealth or use tax policy or other incentives to reward specific interest groups with special favors or perks? Conversely, does it eliminate special favors and perks in the tax code or public policy?
  • Does it perform a function that can and should be performed by the private sector or restore functions to the private sector?
  • Does it grow or shrink the regulatory scope of an agency?
  • Does it directly or indirectly create/reduce taxes, fees, or other assessments?
  • Does it increase or decrease control of the private sector through rules, regulation, or statute?
  • Does it increase or decrease long-term debt or override or restore statutory or constitutional protections against long-term debt?
  • Does it give or reduce special benefits for government employees or politicians?
  • Does it promote government transparency and openness or does it restrict access to information that should be in the public domain?

It should be noted that the complexity not only of the law but of political theory in general can make assessments of the sort described above subjective and very difficult. People reviewing the index should consider the results to be the best judgment of the Center, given our collected experience and expertise.

Download: Freedom Index 2012 Scorecardlegislator votes, bill explanations, and rankings

Policy Reform: Enact Collective Bargaining Reforms

Up to $250 million per year can be saved in RI


Collective Bargaining Costs

All workers deserve  fair compensation. However, it is not fair that taxpayers, struggling in a poor state economy, must also be forced to pay for excessively high compensation packages for unionized government workers. With reforms to collective bargaining, undue union influence and election cronyism can be reduced.

The ever-increasing total cost of employment for unionized government labor — annual  compensation plus benefits — is a cost item we simply can no longer afford.

It’s time to face the facts: public-sector unions drain precious resources away from Rhode Island’s sick, elderly, youth, and poor.

See “Collective Bargaining Reform” policy brief …


Policy Reform: Repeal the Estate Tax

High death tax puts Rhode Island economy further into grave

The Ocean State should be the ideal location to raise a family, run a business, and build an estate that endures for generations. Our state benefits when wealthy people live within our borders, expanding our tax base, paying more taxes, increasing potential investment in businesses, and making greater contributions to local charities.
Why do we keep driving our rich to other states with one of the most punitive death taxes in the country? Financial planners openly state that they advise their wealthy clients to leave the Ocean State if they want to maximize their financial situation.


Recent analysis of migration data shows that Rhode Island is losing people and money to other states, especially Florida, which does not have an estate tax.

In fact, after Florida’s estate tax was eliminated in 2004, the average out-migration of income from Rhode Island to Florida leapt by 77 percent. Removing the estate tax would help level the playing field with Florida, and all states, and perhaps convince a few ex-residents to return home.

(click image to view larger size)

View OSPRI’s landmark “Leaving RI” report here (see page 13 for Estate Tax discussion) … 

Policy Reform: Require Accuracy In Pension Accounting


Municipalities are understating the true cost of unfunded pension liabilities

Government employees need to properly plan for their retirements. Municipal officials need to have predictable budgets from which to provide quality education and city services. Taxpayers need to know that budget shortfalls will not raise their property taxes. Before local pension funding formulas can be effectively developed, it is essential that Accuracy in Pension Accounting be required of all municipalities.

The assumed rate of return that most government entities have traditionally used to estimate pension liabilities has been widely discredited as overly optimistic. A more conservative market rate, similar to what is used in the private sector, is generally seen as a more accurate measurement.

When a private company, like Enron, used improper accounting practices, the wrong-doers ended up in jail. When our local governments understate pension liabilities, retirement plans are put at risk, our schools suffer, local services are cut, and taxpayers pay more from their pockets.

At an October 2012 pension forum state and local officials openly admitted that it would be politically inconvenient to disclose the true scope of the problem to their constituencies.

This can all change with accurate accounting.

Read more about our “Truth in Pension Accounting” movement here … 


Policy Reform: Reduce State Minimum Wage to Federal Level

Teen Employment and Weekly Hours worked are steadily dropping in RI


Minimum wage increases helping to sink teen employment in the Ocean State

As teens transition into adulthood and self-reliance, the likelihood of developing crucial career skills, of building their personal networks and résumés, and of earning valuable spending money is diminishing in Rhode Island. Moreover, a higher minimum wage is drag on jobs development for everyone looking for entry-level work.

See our “Teen Employment” policy brief here … 


Policy Reform: Reduce Occupational Licensing Mandates

Occupational licensing laws hurt low income workers in Rhody

The quid-pro-quo cycle of Cronyism

The quid-pro-quo cycle of Cronyism

Rhode Island workers should be free of unnecessary fees and licensing requirements when pursuing an opportunity to earn a living, especially lower income workers hoping to embark on a new career path. Consumers will enjoy lower prices when some of these barriers are torn down.


With the 2nd most burdensome level in New England and 13th nationally, Rhode Island makes it more difficult and costly for many of us to embark on new careers. During these trouble economic times in the Ocean State, it is especially important that RI workers have enhanced freedom and face fewer barriers when beginning gainful employment.

A. Eliminate the Annual Minimum Corporate (Franchise) Tax

While formally a tax, this entrepreneur-killing law is really more of a licensing fee. It requires all corporate entities – brand new or not; profitable or not – to pay a minimum fee of $500 per year to the state in order to retain its license to do business – yet another disincentive to start a business that can create jobs.

B. Other Occupational Licensing Reforms:

  1.  Create a “sunrise” provision that requires advocates of new licensing proposals to prove their need before they are approved.
  2.   Ensure that all licensing boards have a super-majority of members drawn from the general public rather than the profession itself.
  3.   Replace mandatory licensing with voluntary certification in professions that do not directly affect the safety of the general public.
  4.   Implement a “sunset” provision that requires all other current licensing laws to expire, unless they are periodically reauthorized after a rigorous review process.
  5.   Enact legislation protecting the right to earn a living.

View the Center’s “Occupational Licensing” policy brief here … 

View Occupational Licensing Study by the Institute for Justice … “(Licensing) Boards Behaving Badly”