Rhode Island Employment Snapshot, May 2015: Hockey Sticks and Cliff Jumping

[Click here for the printable one-page PDF of this post.]

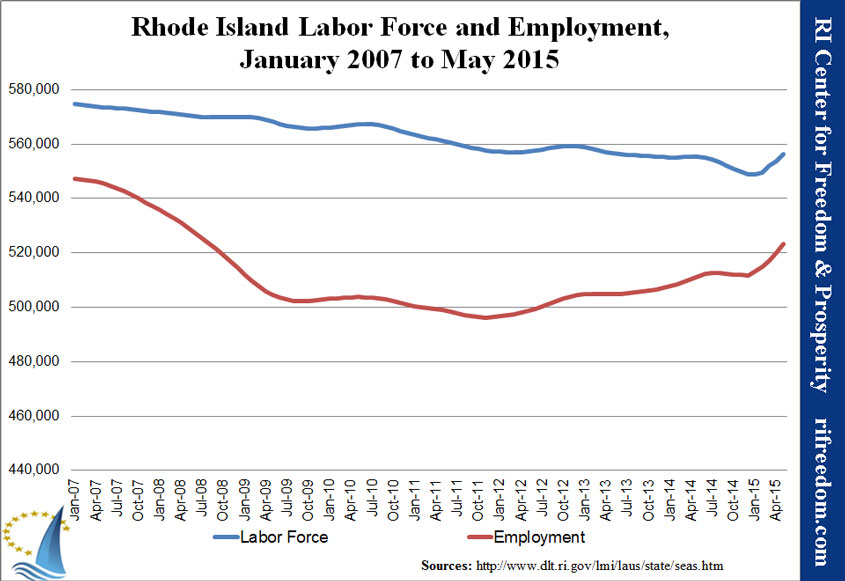
The headline news is that Rhode Island’s unemployment rate dipped below 6% in May for the first time since November 2007, according to the federal Bureau of Labor Statistics (BLS). For some perspective, a fifth grader grinding out the space between Thanksgiving and Christmas when the Ocean State’s unemployment rate left the 5-6% range behind was preparing to graduate from high school when it slipped the other way.

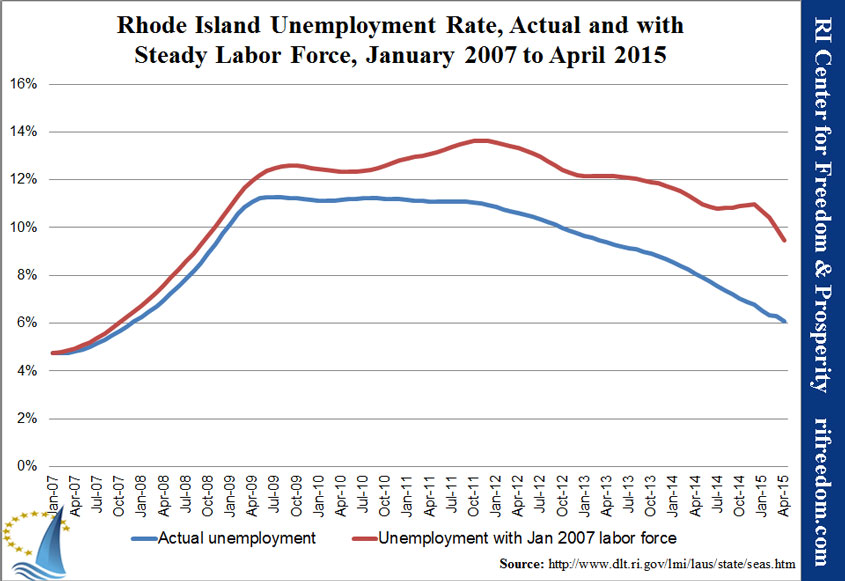
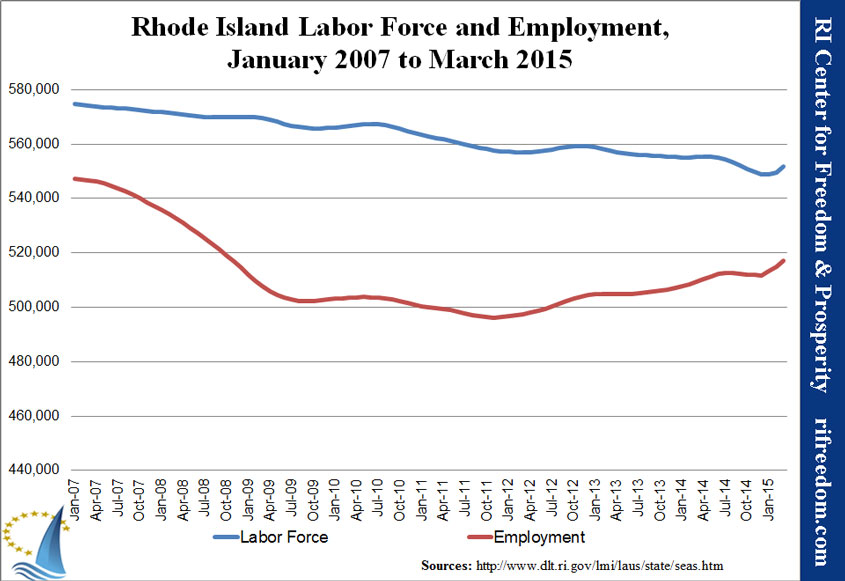
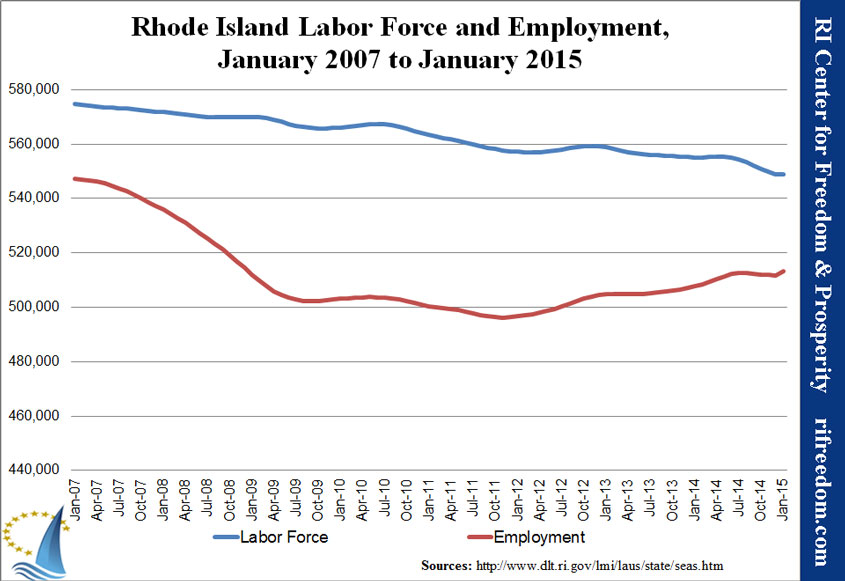
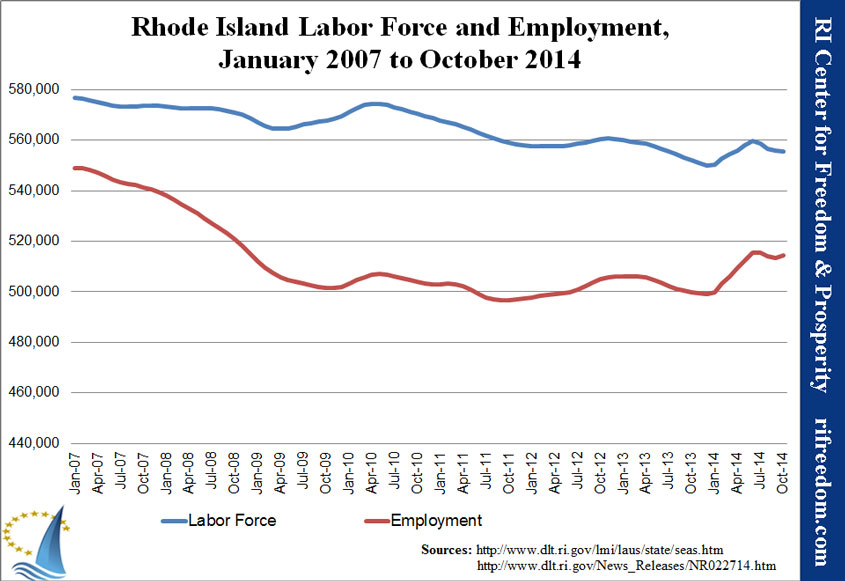
Improvement in Rhode Island’s employment numbers has been a long slog, and as recently as this October, the unemployment rate was still over 7%. In late 2013, the unemployment rate began falling about a full percentage point every six months, roughly. The big difference of the last six months, as the first chart below shows, is that the reason isn’t that the labor force kept disappearing. We’re in hockey-stick territory, now. (That is if one believes the numbers; these first-half boosts have tended to be revised down significantly.)

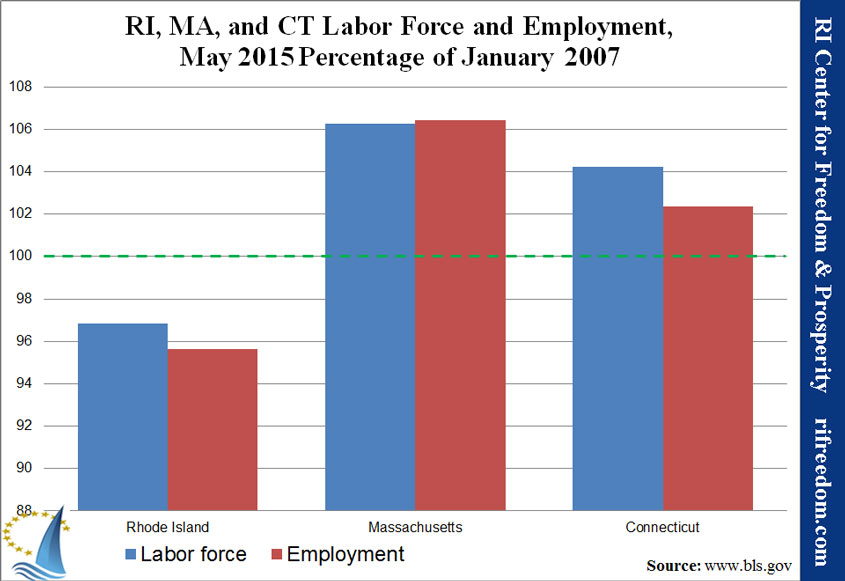
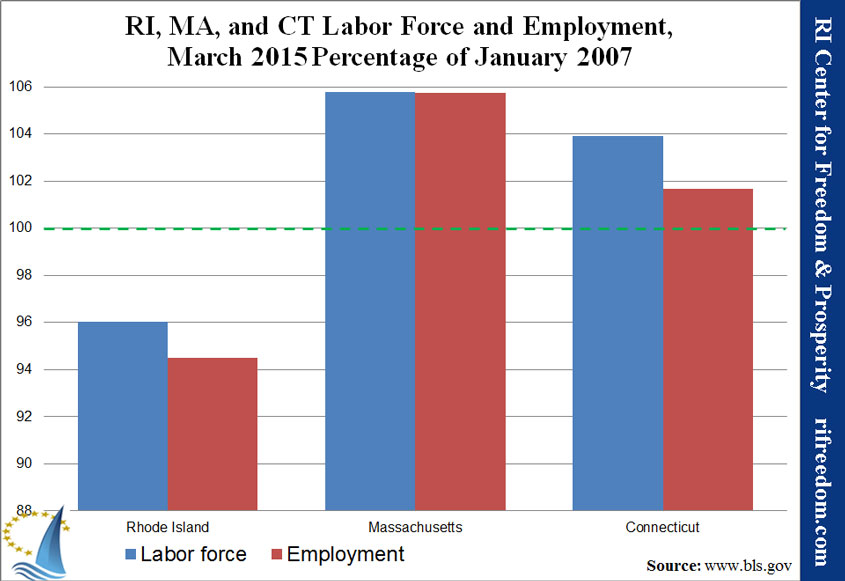
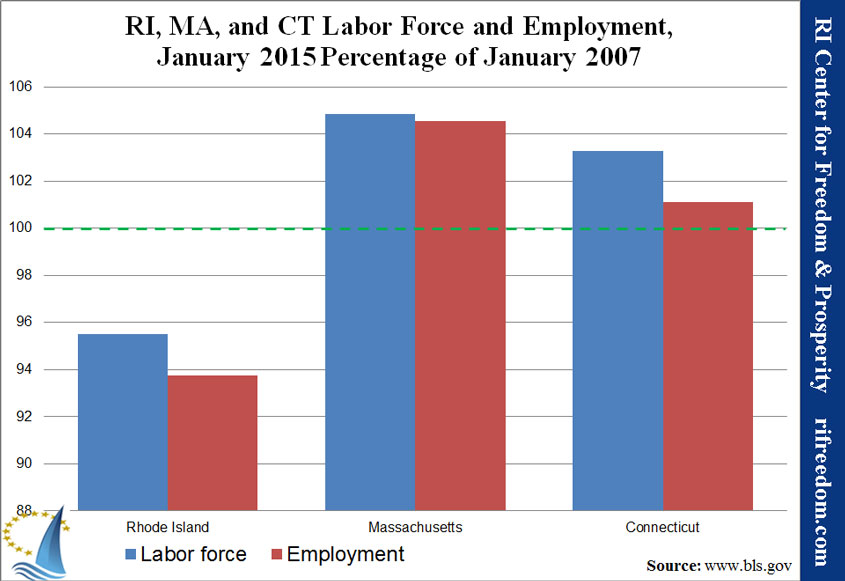
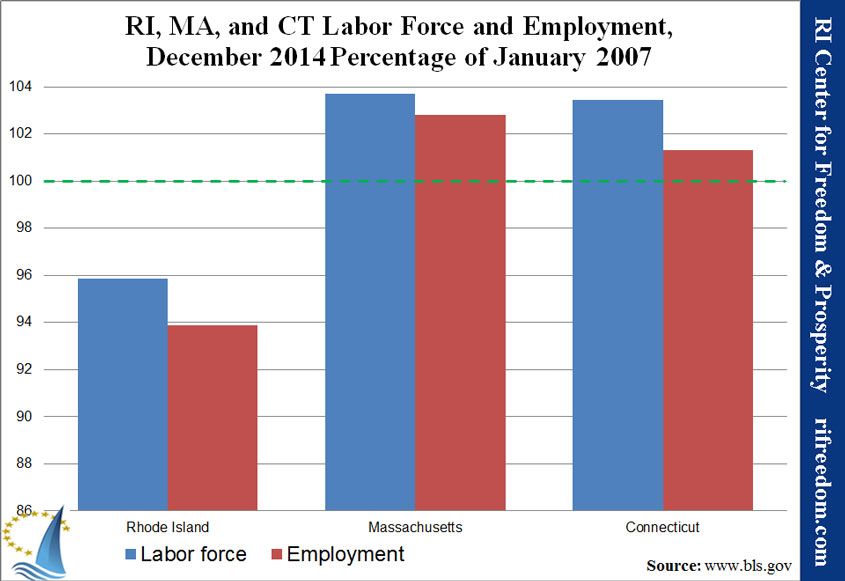
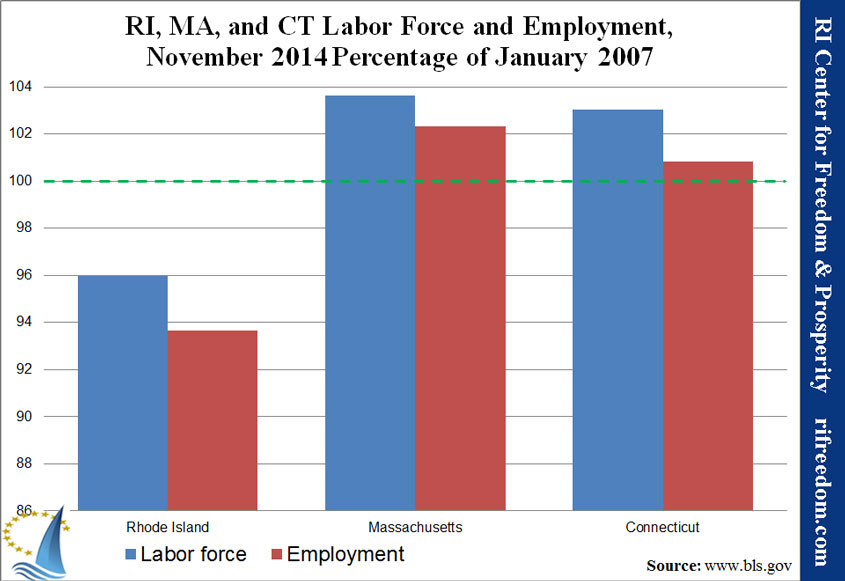
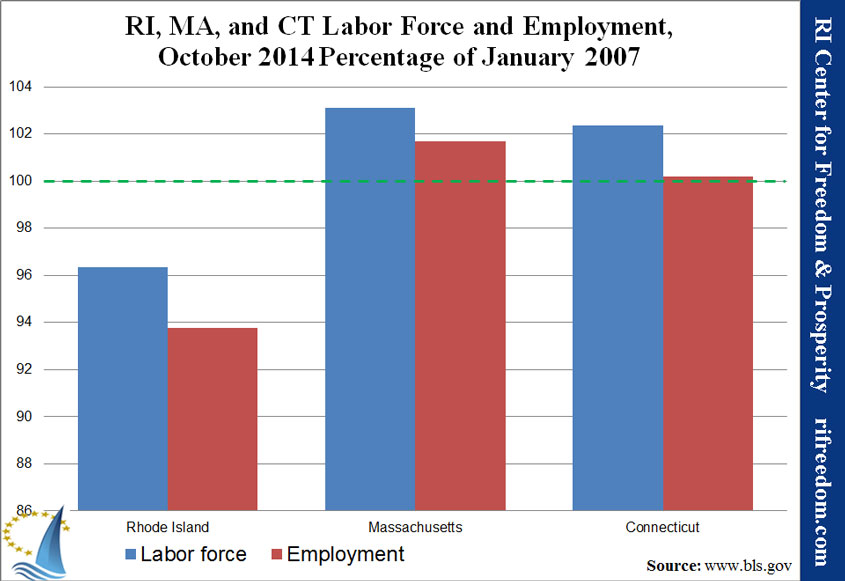
The second chart shows that Rhode Island remains far behind its neighbors when it comes to recovering lost employment. Both Connecticut and Massachusetts are now well above their labor force and employment rates as of January 2007, while Rhode Island isn’t even close. For those two states, however, the increase in employment and (especially) labor force is not quite as recent a development.

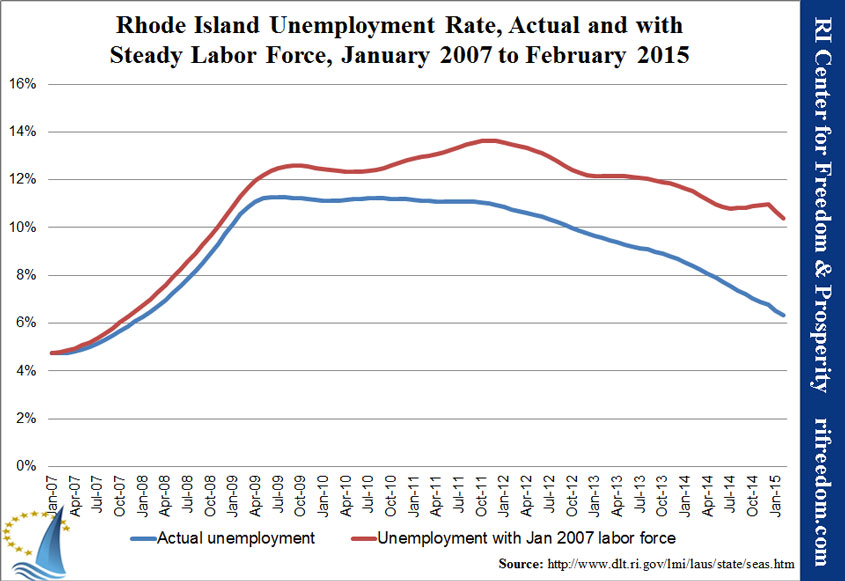
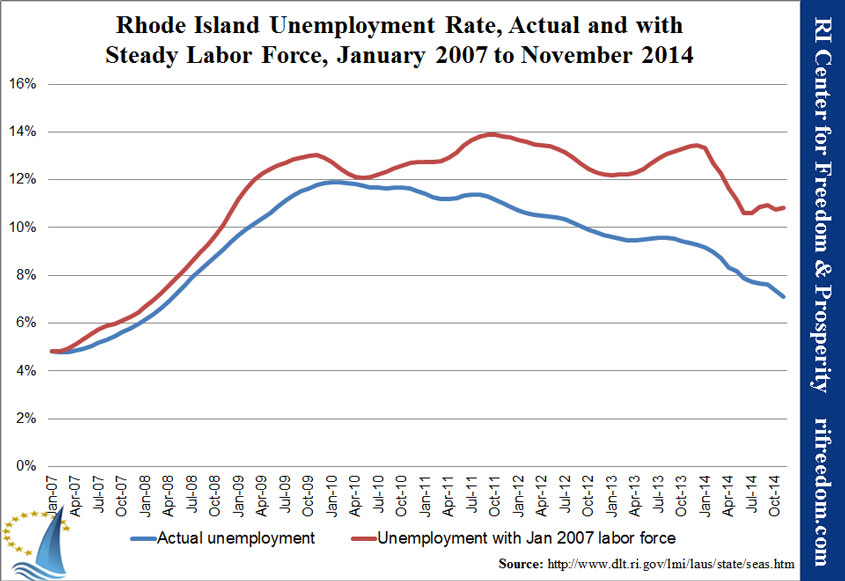
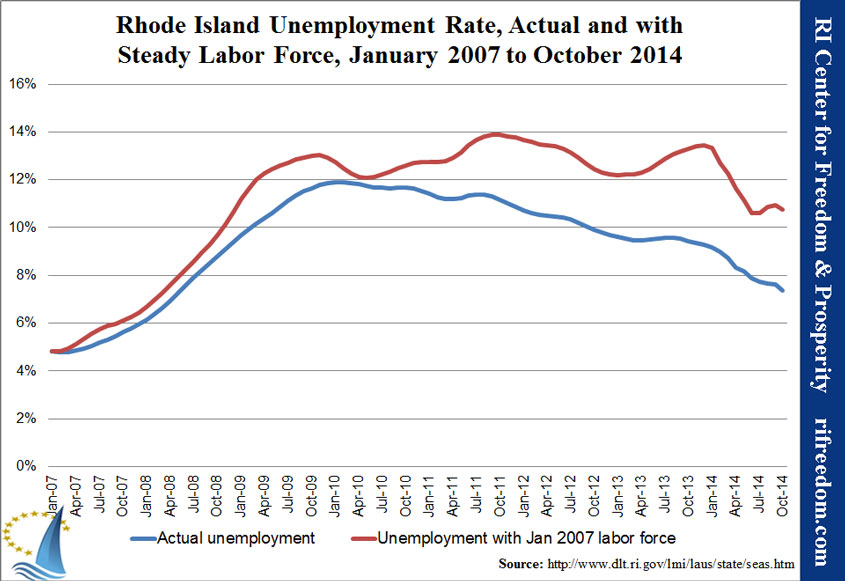
The third chart shows how peculiar the numbers actually are. Both labor force and employment are supposed to come independently from survey data, pegged to certain benchmarks, but the blue line, which shows the actual employment data, presents a smooth downward curve. The red line shows what the curve would have been if the labor force had not shrunk since January 2007, and it ends in a conspicuous cliff.

In May, unemployment would still have been 8.9%. More tellingly, though, it would still have been 11.0% as recently as December.

RI-laborforceandemp-0107-0515

RIMACT-laborforceandemp-0515perc0107

RI-unemploymentrate-steadyLF-0107-0515

Rhode Island Employment Snapshot, April 2015: The Annual Wait for Realistic Numbers

[Click here for the printable one-page PDF of this post.]

In a news report that drifted into this author’s awareness, recently, an analyst explained Rhode Island’s employment boost in terms of seasonal changes. To the contrary, the numbers are supposed to be seasonally adjusted (to bring out underlying trends), and the pattern of this year looks a lot like the patter of last year. Rhode Island begins the first six months with an inexplicable jump in employment, which levels off or decreases and is followed by a substantial downward revision when the data for the year is in.

Therefore, as we assess the Ocean State’s 6.1% unemployment rate, as reported by the federal Bureau of Labor Statistics (BLS), which is now out of the bottom 10 nationally and is not the last in New England, we should be aware that we’re likely just in the (largely unrealistic) annual upswing.

According to the BLS, in March, a net 2,846 Rhode Islanders gained employment, while 1,826 joined the labor force. Those two variables are the basis for the unemployment rate. The first chart below shows that this year represents the start of a rebound in a long decline… if the numbers are correct.

The second chart shows how far Rhode Island is behind its neighbors. (Note that this month’s iteration has a different axis to accommodate Massachusetts’s growth.) Both Connecticut and Massachusetts are now well above their labor force and employment rates as of January 2007, while Rhode Island isn’t even close. Indeed, beginning in April, Massachusetts now has better growth in employment than in labor force.

The final chart shows the importance of labor force. The blue line is the official unemployment rate; the red line is what the rate would be if residents weren’t giving up their quest for work. Unemployment would still be 9.5% in Rhode Island with the January 2007 size of the labor force.

RI-laborforceandemp-0107-0415

RIMACT-laborforceandemp-0415perc0107

RI-unemploymentrate-steadyLF-0107-0415

Rhode Island Employment Snapshot, March 2015: A Return to Seasonal Overstatement?

[Click here for the printable one-page PDF of this post.]

Rhode Island’s employment data has developed a seasonal pattern — and it isn’t captured in the “seasonal adjustments” that the federal Bureau of Labor Statistics (BLS) applies to the data. Throughout the spring and early summer, employment numbers in the Ocean State undergo inexplicable improvement with no relation to other empirical or anecdotal evidence in the state. In the latter half of the year, the increases stop, perhaps receding a bit. Then, the BLS revises the numbers the following January, dropping both employment and the labor force (employed plus looking for work) and smoothing out the curves.

We’re currently in the inexplicable-growth season.

According to the BLS, in March, a net 2,401 Rhode Islanders gained employment, while 2,074 joined the labor force. Those two variables are the basis for the unemployment rate. The first chart below shows that, with the melting of the snow, the labor force turned around its steady, eight-year decline, while employment has taken off like a rocket. We’ll see.

The second chart shows the degree to which it will take more than statistical blips for the Ocean State to catch up with its neighbors. Both Connecticut and Massachusetts are now well above their labor force and employment rates as of January 2007, while Rhode Island isn’t even close. With the annual downward revisions of the monthly estimates, it’s been a long, frustrating climb for Rhode Islanders.

The final chart illustrates the point from a different angle. The blue line shows the official unemployment rate; the red line shows what the state’s unemployment rate would be if residents weren’t giving up their quest for work. With the big jump in the labor force, the difference between the two lines dropped, this month. Still, unemployment would be 10% with the January 2007 size of the labor force. Conspicuously, though, the labor force only jumps when employment does. Otherwise, the unemployment rate would go up, which is something the public would notice.

RI-laborforceandemp-0107-0315

RIMACT-laborforceandemp-0315perc0107

RI-unemploymentrate-steadyLF-0107-0315

Rhode Island Employment Snapshot, February 2015: The Darker Way to Improve the Unemployment Rate

[Click here for the printable one-page PDF of this post.]

If Rhode Islanders haven’t completely tuned out reports about the state’s unemployment rate, they may have heard the triumphant call, this week, that not only has their state climbed out of the lonely pit in the bottom three of the national ranking, but it’s no longer even last in New England. Looking at the data, however, shows how inapplicable a metaphor like “climbed out” is.

According to the federal Bureau of Labor Statistics (BLS), in February, a net 1,725 Rhode Islanders gained employment, while 659 joined the labor force. Those two variables are the basis for the unemployment rate, and as the first chart below shows, the lines are generally moving toward each other. That has the effect of reducing the unemployment rate more quickly than the modest increases in employment would generally suggest.

The second chart shows how ridiculous it is to portray Rhode Island as doing better than Connecticut. The Nutmeg State has a higher unemployment rate because, despite its much stronger increases in employment, even more people have decided to look for work, there. In other words, its higher unemployment rate is ultimately an indication of its better economic health.

The final chart illustrates the condition that the Ocean State would be in if its residents weren’t giving up their quest for work. Even with recent improvements in employment, the unemployment would still be 10.4% if as many people were looking for work as were doing so in January 2007.

RI-laborforceandemp-0107-0115

RI-laborforceandemp-0107-0115

RI-laborforceandemp-0107-0115

Rhode Island Employment Snapshot, January 2015: After Revision, Still in Decline

[Click here for the printable one-page PDF of this post.]

The headline that people invested in Rhode Island’s status quo would like to see, based on the latest employment numbers for the state, is that the unemployment rate is now 6.5% — the best since early 2008 and fully eight slots from worst in the country. As the charts below show, such a headline would be misleadingly sunny.

According to the federal Bureau of Labor Statistics (BLS), in January, a net 1,489 Rhode Islanders gained employment, while 19 left the labor force. The first number is positive, but the second one illustrates how trumpeting the unemployment rate misses the point. As the first chart shows, the number of people either working or looking for work continues on a long-term decline. In fact, Rhode Island’s labor force hasn’t been this small for thirteen years, in 2002.

As for the one-month improvement in Rhode Island, the second chart shows it to be a mere drop in the bucket compared with the neighboring states of Massachusetts and Connecticut. (Experience also suggests that it will be revised down in the months and years to come.)

The final chart illustrates the condition that the Ocean State would be in if its residents weren’t giving up their quest for work. Unemployment would still be well above 10% if as many people were looking for work as in January 2007.

Indeed, the best news that Rhode Island could receive would arguably be that it’s unemployment rate is going up because more people were returning to the labor force than the economy could supply with jobs.

RIemploymentsnapshot-0115 RI-laborforceandemp-0107-0115

RIMACT-laborforceandemp-0115perc0107

RI-unemploymentrate-steadyLF-0107-0115

Rhode Island Employment Snapshot, December 2014: With Revision Looming, the Job Market Erodes

[Click here for the printable one-page PDF of this post.]

Labor force and employment numbers from the federal Bureau of Labor Statistics (BLS) are due for their annual revision, soon, and there’s reason to believe Rhode Island will see its 2014 lose some of its rosey sheen. However, even before that happens, if it happens, the state’s unemployment rate — which fell below 7% in December for the first time since April 2008 — does not indicate what most residents probably believe that it indicates.

According to the BLS, in December, a net 1,266 Rhode Islanders gained employment, while 698 left the labor force — which means they’ve stopped looking for work. That combination explains why the unemployment rate dropped so much (to 6.8%, from 7.1%) month to month

The first chart at right shows how the labor force continues its decline. The chart also puts the seemingly significant increase in employment in perspective. The first half of 2014 saw a large (and inexplicable) jump in employment, but the second half saw no improvement at all — indeed, a small decrease.

The second chart shows how far behind Rhode Island continues to be. Both of the Ocean State’s neighboring states are now well above their labor force and employment levels of January 2007. Rhode Island? Not even close, and not improving.

The final chart illustrates what the unemployment rate would look like if the labor force weren’t shrinking. Even with the employment boost in December, Rhode Island’s unemployment rate would still be well over 10% if as many people were looking for work as were working or looking in January 2007. Specifically, Rhode Island’s unemployment rate would have been 10.6% in December.

RI-laborforceandemp-0107-1214

RIMACT-laborforceandemp-1214perc0107

RI-unemploymentrate-steadyLF-0107-1214

Rhode Island Employment Snapshot, November 2014: RI’s Different Path

[Click here for the printable one-page PDF of this post.]

The United States hit a milestone, in November, with the average state now claiming more employed residents than it had during its pre-recession peak.  Rhode Island, by contrast is headed in the other direction.

According to the federal Bureau of Labor Statistics (BLS), in November, a net 507 Rhode Islanders lost employment, while 2,052 left the labor force — which means they’ve stopped looking for work.  That’s why the unemployment rate is going down, because more than four times as many people stopped being counted than lost their employment.  The first chart below tells the tale.

The local story appears in the second chart.  Both of Rhode Island’s neighboring states are now well above their labor force and employment levels of January 2007.  Rhode Island? Not even close, and not improving.

The final chart illustrates the condition that the Ocean State would be in if its residents weren’t giving up their quest for work.  Unemployment would still be hovering around 11%, if as many people were looking for work as in January 2007. Specifically, Rhode Island’s unemployment rate would have been 10.8% in November.

RI-laborforceandemp-0107-1114

RIMACT-laborforceandemp-1114perc0107

RI-unemploymentrate-steadyLF-0107-1114

Rhode Island Employment Snapshot, October 2014: Flatlining and Worse

The commentary coming out of Rhode Island’s monthly employment data for October has generally been about the mixed results.  Employment (people who tell interviewers that they are working) was up 1,124 people from September, but the labor force (people telling interviewers that they are working or looking for work) was down 336, while jobs (tax and survey data about jobs that actually exist in Rhode Island) were down 2,600.

Some of the commentary has suggested that Massachusetts is hiring Rhode Islanders at a high rate, but that seems unlikely.  Combined, Connecticut and Massachusetts created 4,800 jobs, well over what Rhode Island lost.  However, between Rhode Island’s two neighbors, an additional 25,285 people stated that they were working.  So, a straightforward analysis would find that the residents in the rest of Southern New England are claiming all the new jobs in their states and then some.

Some of the difference between the metrics may be that employment also includes people who are self employed or working off the books.  As the economy continues to stagnate, in terms of employment, people may increasingly be looking for ways — any ways — to have some income. More likely, however, the numbers are simply off and awaiting a substantial revision, probably making employment more negative and jobs more steady.

Whatever the case, Rhode Island’s official unemployment rate stood at 7.4% in October, according to data from the federal Bureau of Labor Statistics (BLS).  The rate hasn’t been that low since May 2008, but far fewer people say that they are actually looking for work.  That has the effect of improving official unemployment on paper.

The first chart below shows that the substantial increases in labor force and employment of the first half of the year have turned into relative stagnation.

The second chart shows that both Massachusetts and Connecticut have reached the milestone of having larger labor forces and more employment than January 2007.

The third chart shows that the unemployment rate would still be hovering just under 11.0% if Rhode Island’s labor force hadn’t shrunk so much since the beginning of the recession.

RI-laborforceandemp-0107-1014

RIMACT-laborforceandemp-1014perc0107

RI-unemploymentrate-steadyLF-0107-1014


Rhode Island Employment Snapshot, September 2014: What RI Worry?

Rhode Island was one of only 14 states to lose employment in September, according to data from the federal Bureau of Labor Statistics (BLS).  Unemployment in the Ocean State fell to its lowest level since June 2008 (7.6%), but the “improvement” of that metric continues to result from the fact that more people are giving up and leaving the labor force than are losing their jobs, each month.

The first chart below shows the large (and likely-to-be-revised-downward) increase in employment through the first half of the year, plus the more modest increase and more rapid decrease in the labor force.  Together these factors shaved almost two percentage points off the unemployment rate over the past year.

The second chart shows that both Massachusetts and Connecticut continue to surpass, or be close to, their peak labor forces and employment.  Both other Southern New England states saw increases in employment in September.

The third chart shows that the unemployment rate would have increased to 11.0% in September, from 10.9% in August, if Rhode Island’s labor force hadn’t shrunk so much since the beginning of the recession.

RI-laborforceandemp-0107-0914

RIMACT-laborforceandemp-0914perc0107

RI-unemploymentrate-steadyLF-0107-0914

Women and minority jobs have been especially impacted negatively

Workforce Participation Decline in RI Dismal for Women & Minorities

Read how poor public policy in Ocean State is especially hurting non-white men!

[button url=”http://www.rifreedom.org/jobs” target=”_self” size=”medium” style=”royalblue” ] View Workforce Data here [/button]