Rhode Island Employment Snapshot, August 2014: What Goes Up Comes Down

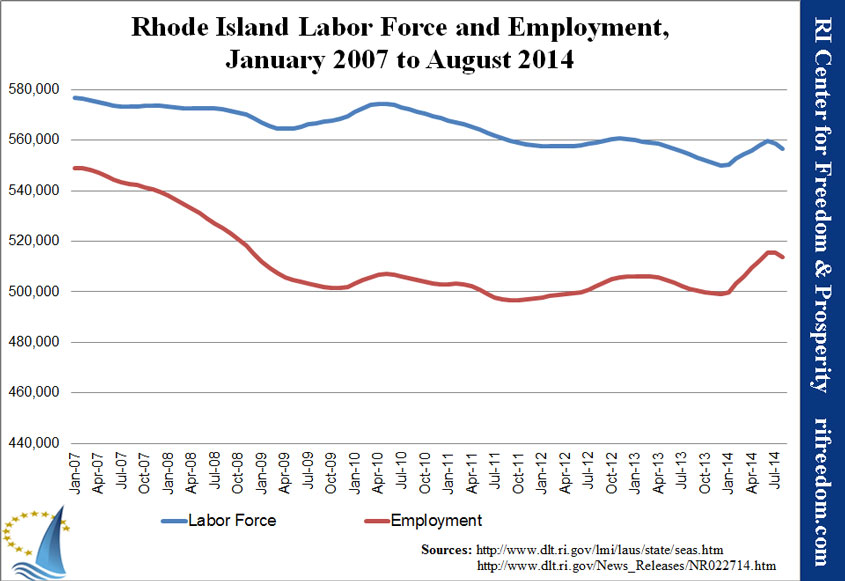
Whether or not one believed the six-month boom in employment that government statistics proclaimed, the trend has turned around in Rhode Island.  The unemployment rate may have frozen at 7.7%, which is definitely an improvement over our nearly six years above 8%, but much of the credit goes to the large reduction in the labor force.

Even if fewer people are working, the unemployment rate goes down if an even larger number of people decide not to look for work.

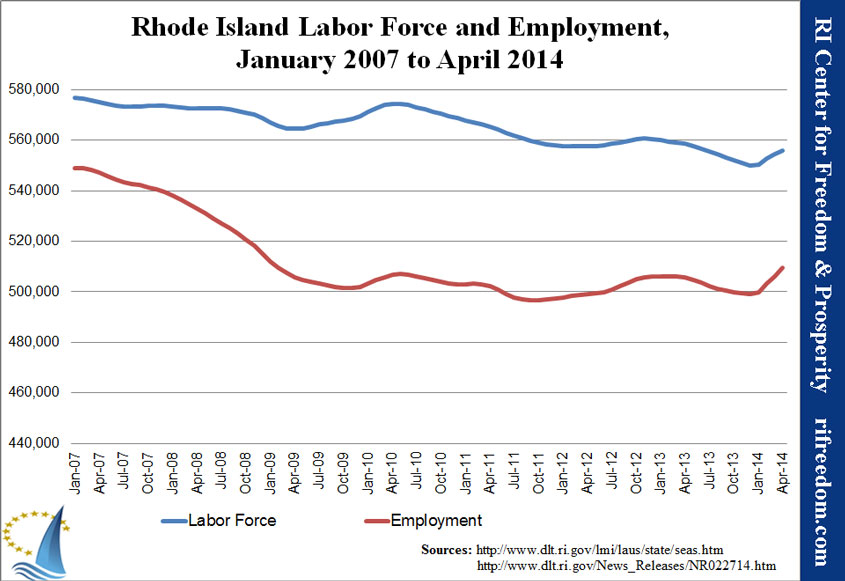
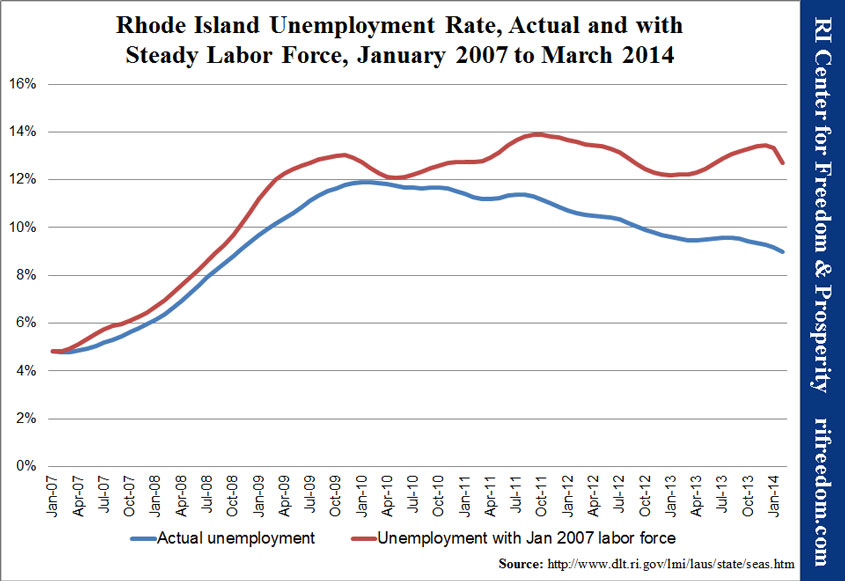
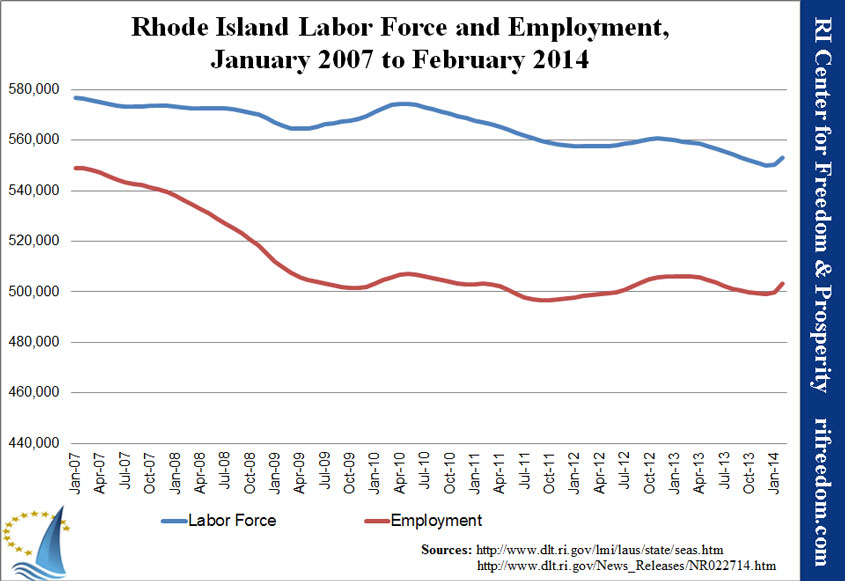
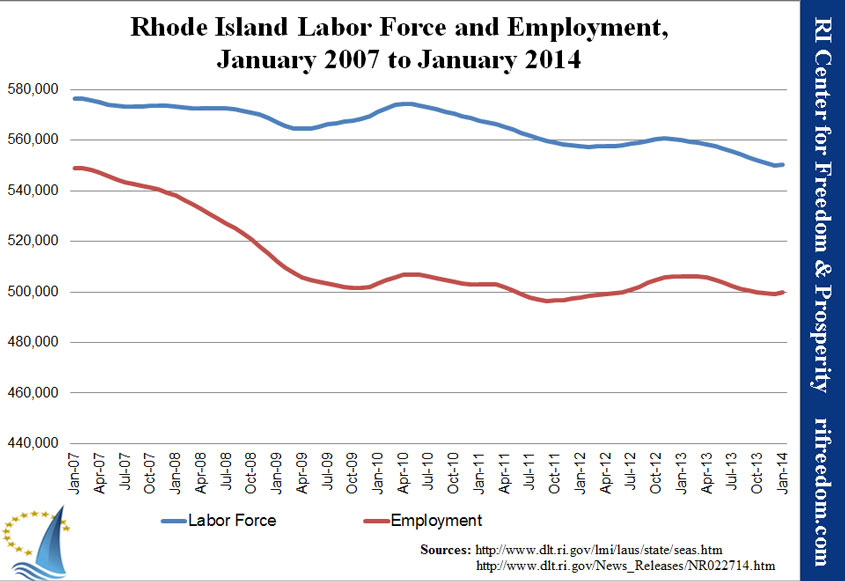
The first chart below shows the dramatic rise of the first six months of the year (which a January revision will likely flatten out) followed by the reversal.  The recent shift of the lines is a good illustration of how the rate works.  If the upper line, which is labor force, had increased more than the lower line, which is employment, the unemployment rate would have gone up.  That circumstance can actually be an indication of a rebounding job market, because it shows that people are sufficiently optimistic to start looking for work again.

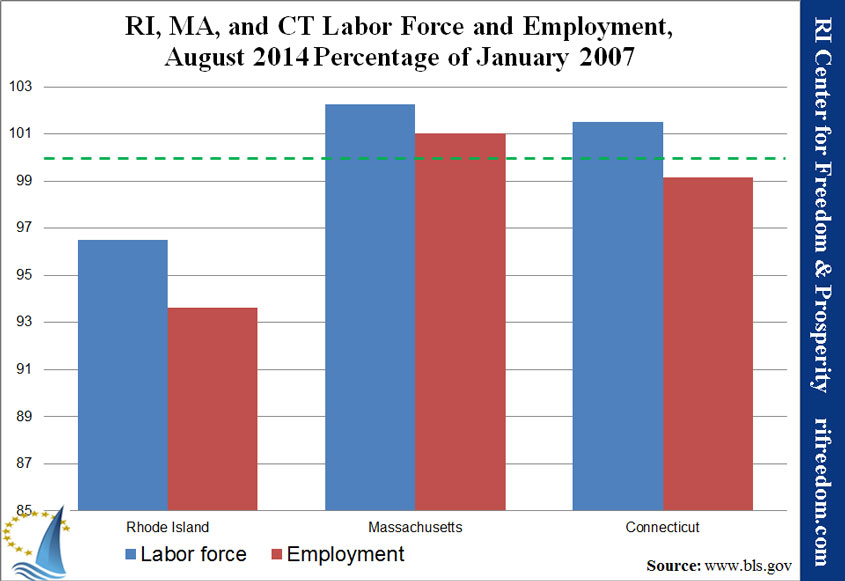
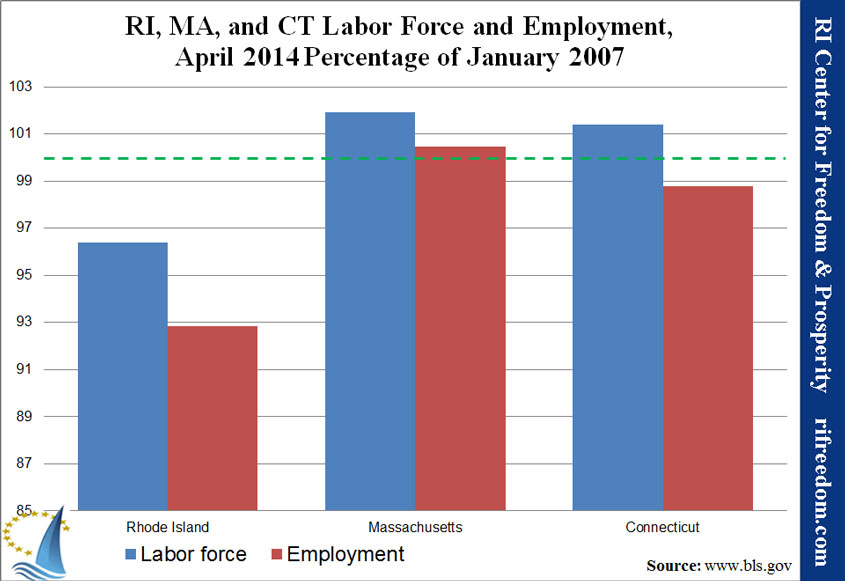
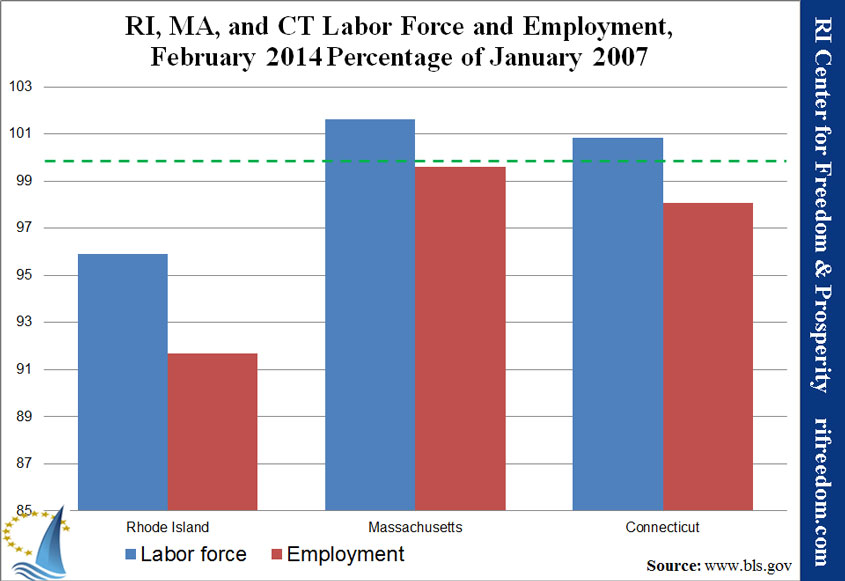
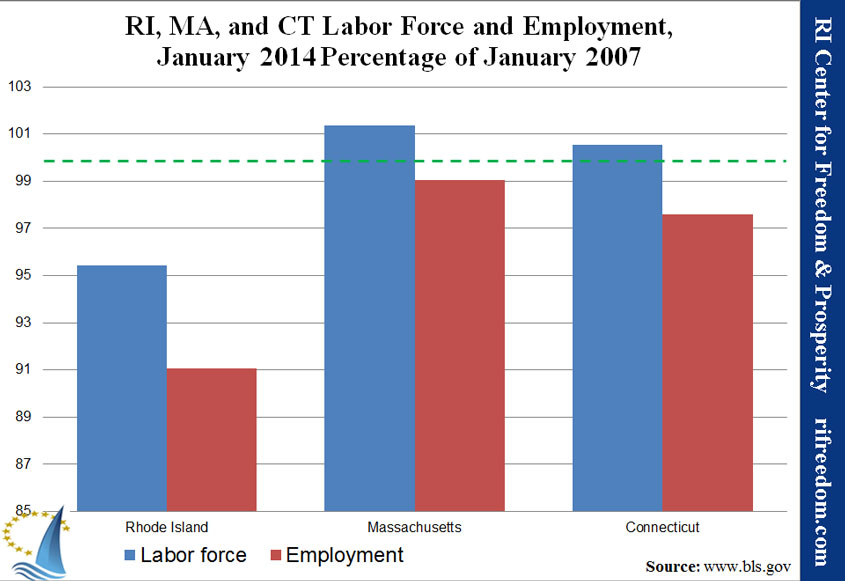
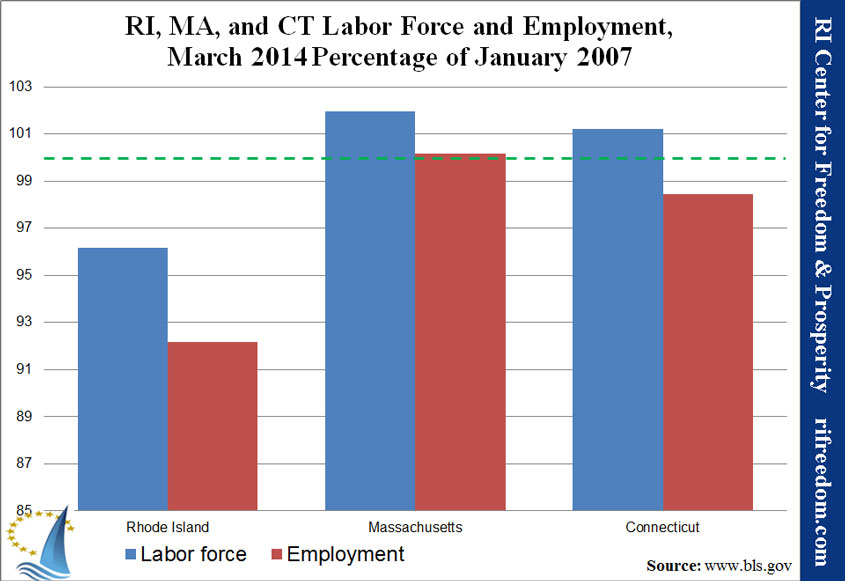
The second chart shows how Rhode Island, Massachusetts, and Connecticut are faring versus their labor forces and employment before the recession.  Clearly, the Ocean State has a long way to go.

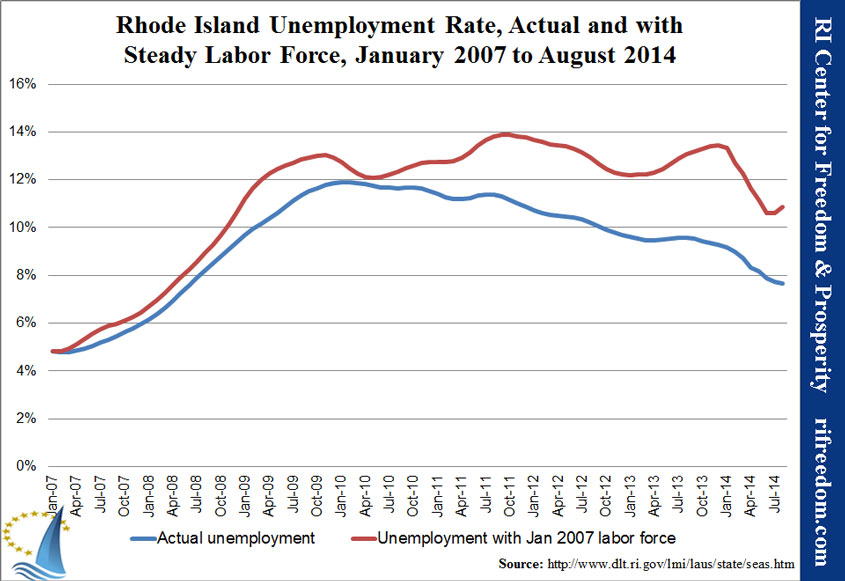
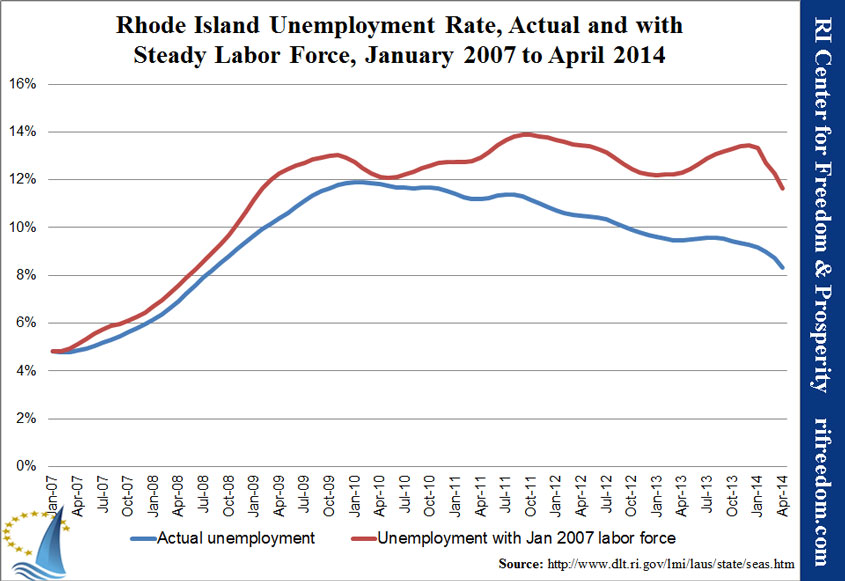
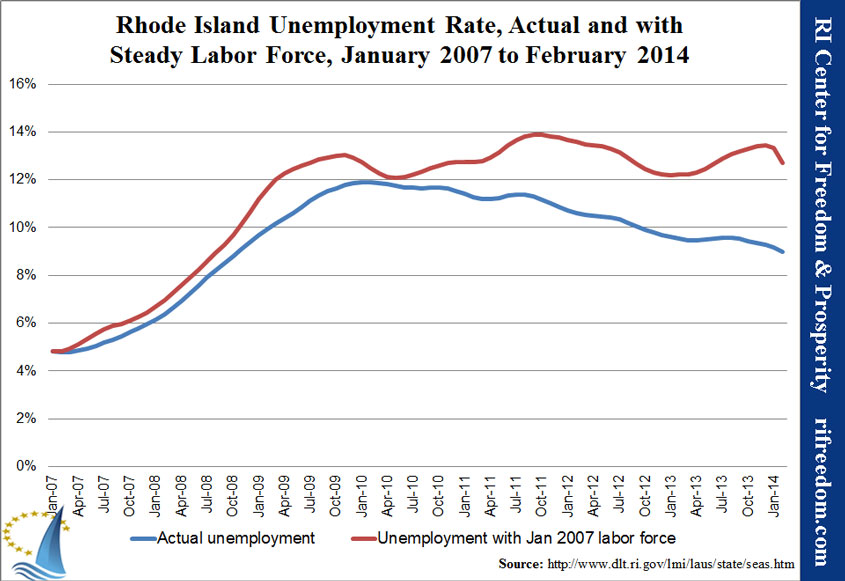
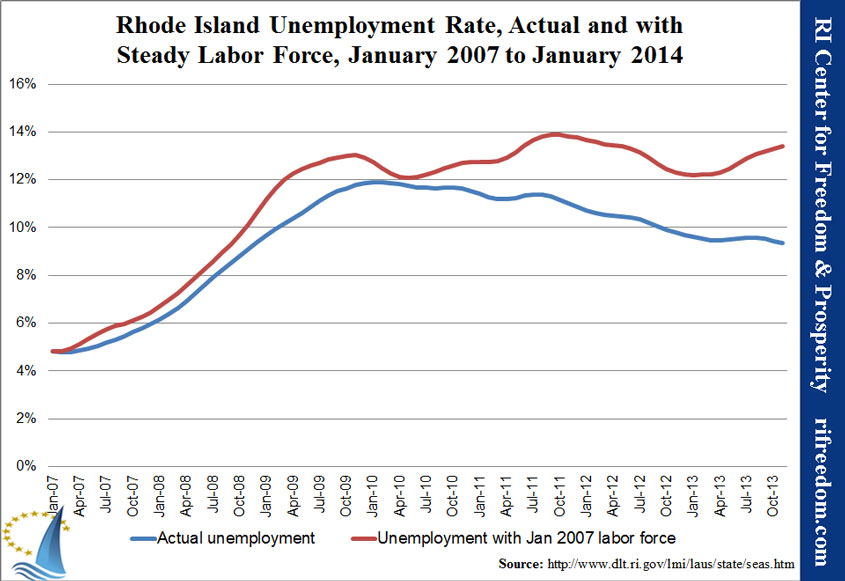
The third chart shows what the unemployment rate would have been if the labor force had remained the same throughout the recession.  The big takeaway is that the unemployment rate would have peaked much higher, but the newer takeaway is the uptick of the red line over the past few months.  What it illustrates is that the unemployment rate would be going back up, rather than freezing or edging down, if more people weren’t giving up on looking for work.

RI-laborforceandemp-0107-0814

RIMACT-laborforceandemp-0814perc0107

RI-unemploymentrate-steadyLF-0107-0814

Rhode Island Employment Snapshot, July 2014: Job Trend Cools in Summer

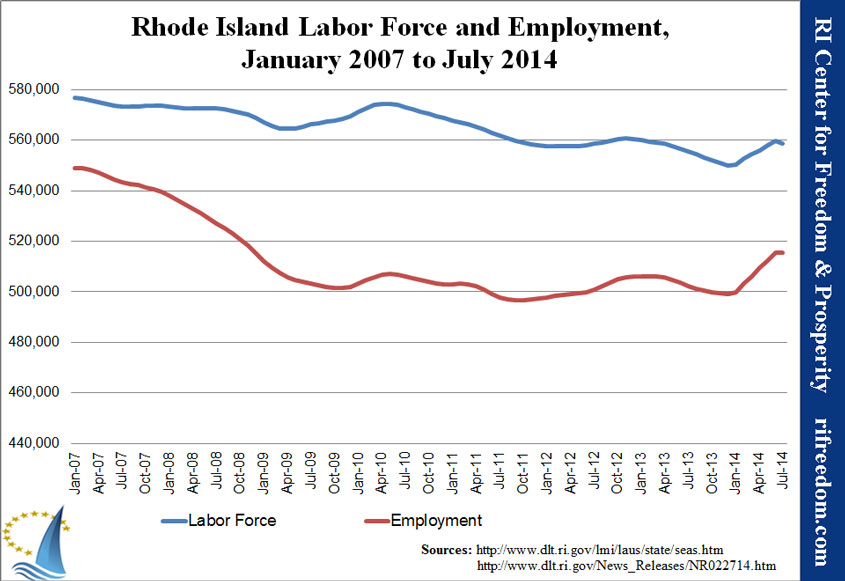
Whether or not there has been any tangible evidence, the statistics have suggested that Rhode Islanders’ job prospects boomed for the first six months of 2014.  The number of employed Rhode Islanders hit a ledge in July, but a state doesn’t lead the country in job growth without showing some gains relative to other states.

In the case of the Ocean State, it managed to slip its unemployment rate below those of the Southern states of Mississippi and Georgia.  For the first time in a long time, that is, Rhode Island doesn’t have the worst unemployment rate in the country.

The safe money, however, should still bet on a dramatic revision to the data, next January.  What the numbers will turn out to show after the election will be interesting to see.

The first chart below illustrates the boom and halt, as well as the multi-year patter that 2014 has shown, thus far.

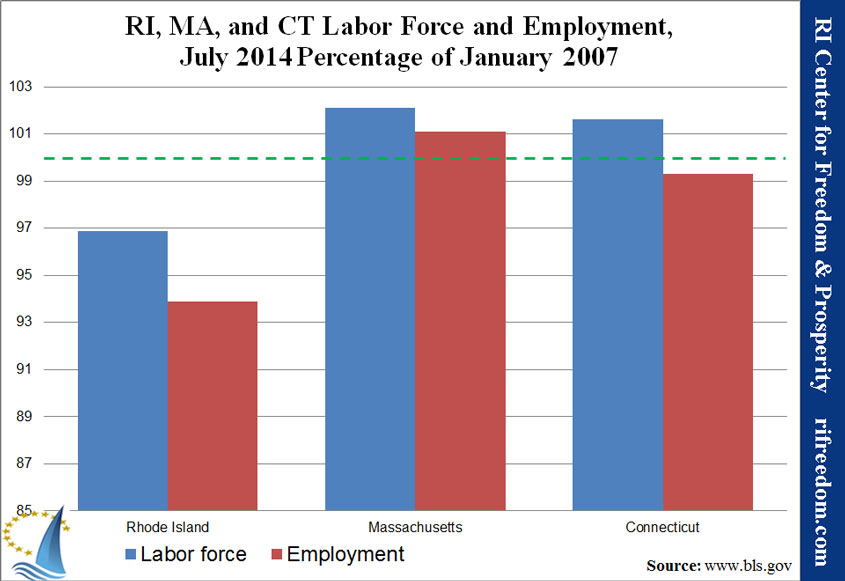
The second chart shows that, however well Rhode Island may compare with distant states in another region, it continues to lag the two neighbors whose economies the Ocean State’s should more closely resemble.

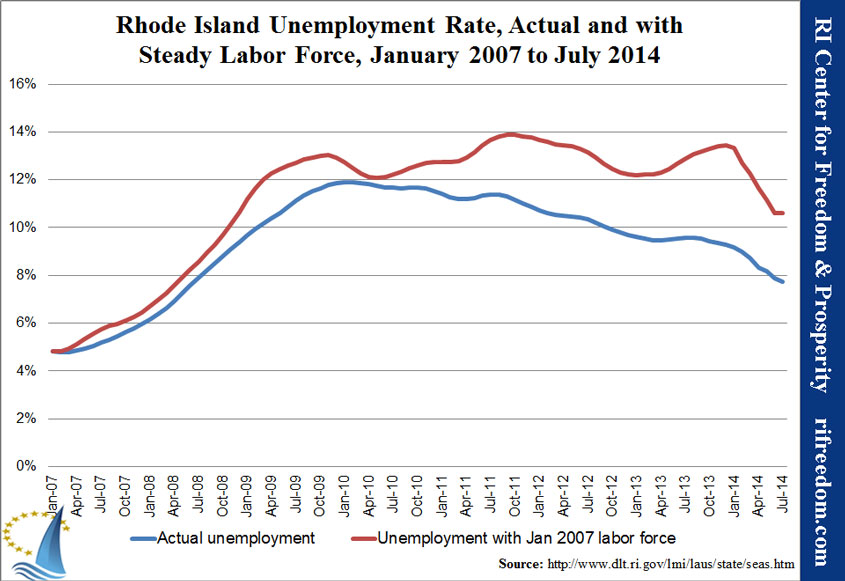
The third chart shows the unemployment rate as it’s been in comparison with what it would have been if so many Rhode Islanders hadn’t stopped looking for work.  (When the total labor force decreases, fewer people who are not working are considered “unemployed” because they aren’t looking for work.)

RI-laborforceandemp-0107-0714

RIMACT-laborforceandemp-0714perc0107

RI-unemploymentrate-steadyLF-0107-0714

Rhode Island Employment Snapshot, June 2014: Really Pushing Credulity

You’ll never guess what Rhode Island’s unemployment rate did in June.  It went down again!  To 7.9%.

That’s still worst in the country (tied with Mississippi), but Rhode Island has now had its best six months of employment growth in recorded history.  For the past three months, the Ocean State has had the most employment growth (as a percentage) in the entire country.  It’s boom-time in the Ocean State, even if we’re still at the wrong side of just about every ranking, and even if it doesn’t feel like things have turned around.

In fact, there were actually 400 fewer jobs based in Rhode Island in June than May, yet, somehow an additional 3,246 Rhode Islanders found work… according to the U.S. Bureau of Labor Statistics, in cooperation with the state Dept. of Labor and Training.

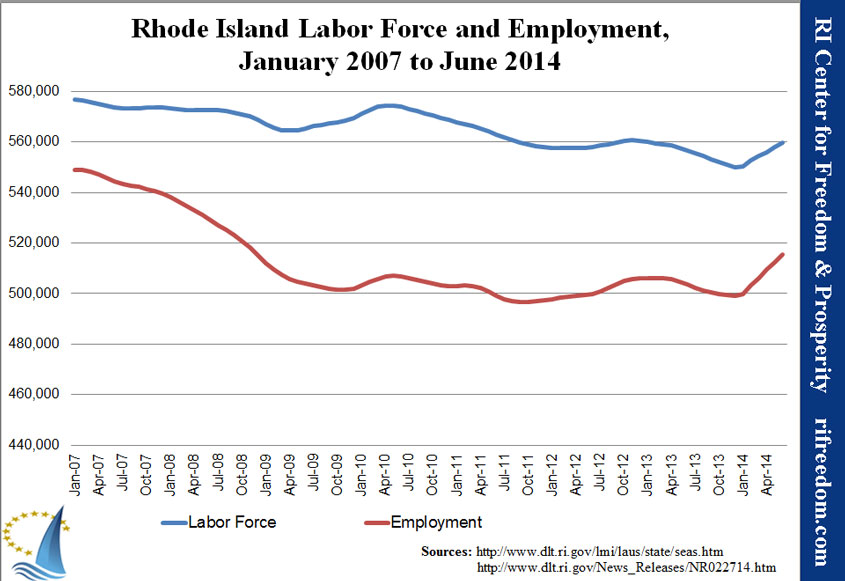
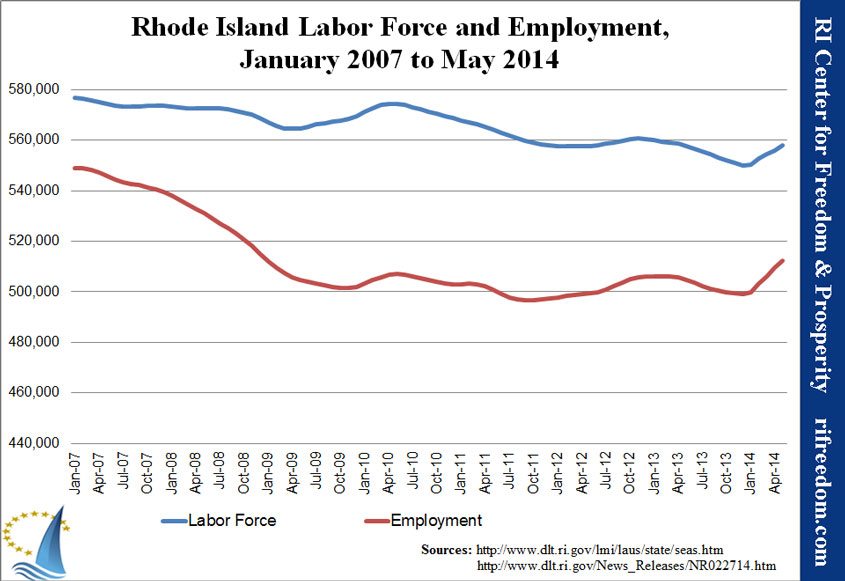
The first chart below illustrates just how bizarre the numbers look, given the state’s recent history. Since December, more than 16,000 Rhode Islanders have found employment.  The total number hasn’t been so high since November 2008.

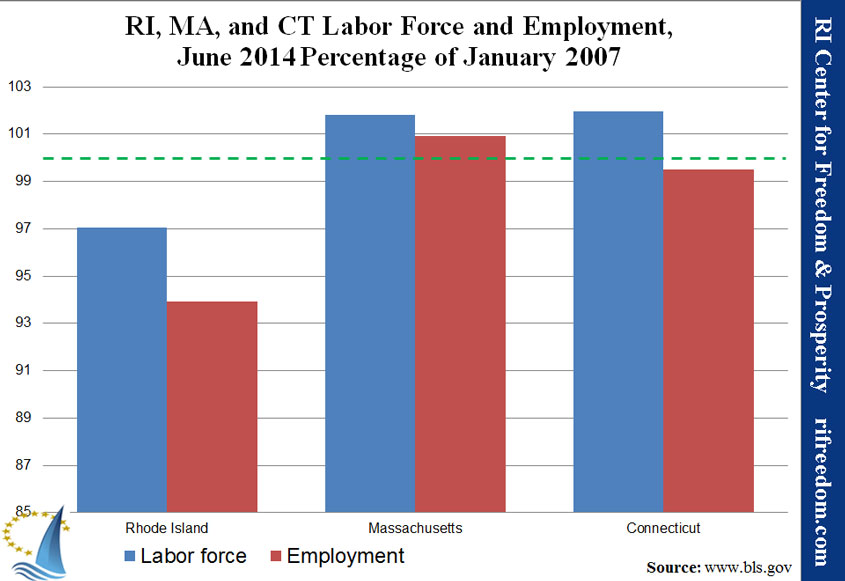
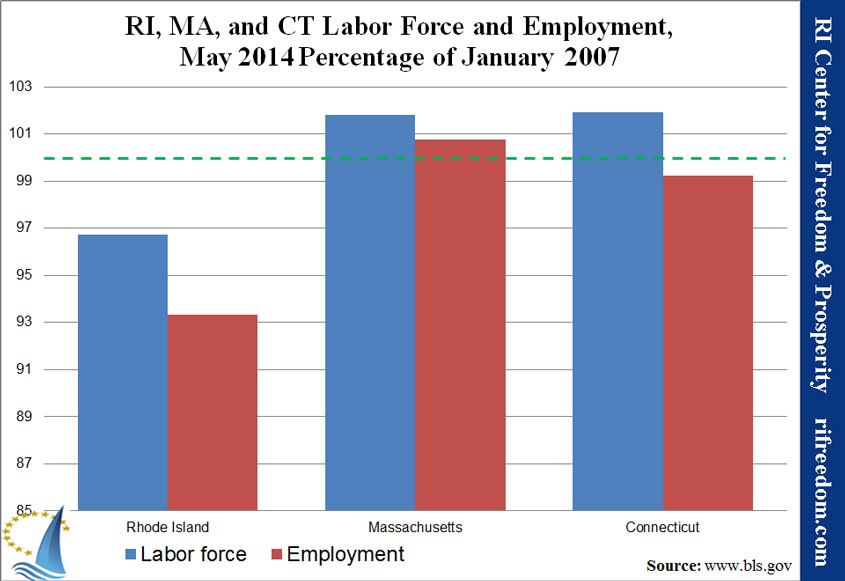
The second chart provides a longer-term sense of the results. Rhode Island is still below its employment level just before the jobs-crash of the recession and still lags both of its neighbors dramatically when it comes to reclaiming jobs.  Indeed, Massachusetts has now surpassed its pre-recession peak, and Connecticut is just about there.

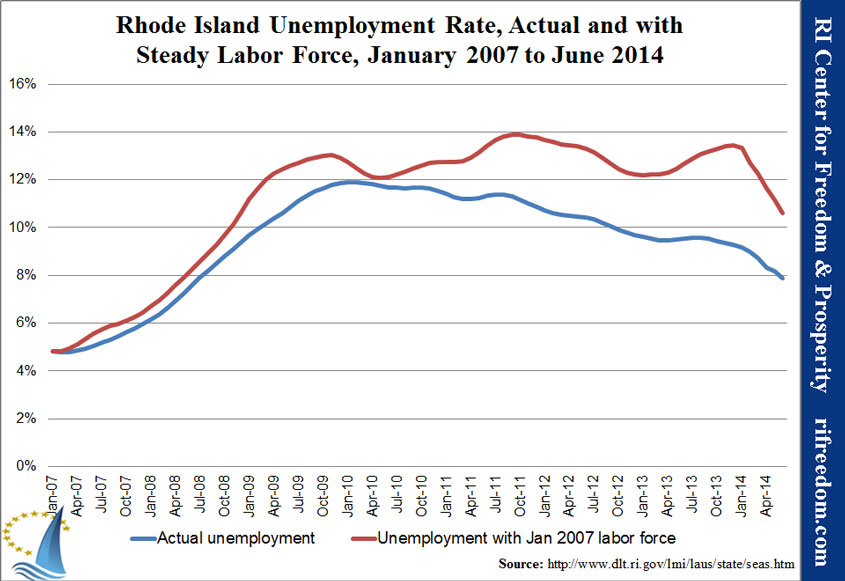
The third chart compares Rhode Island’s unemployment rate with what it would have been if the state’s labor force had held steady. It shows that unemployment never got as low as Rhode Island officials had claimed, and the growth in the gap between the two lines is steadier and more dramatic, with the exception of the peculiar results these past three months.  Even if the results since December reflect real growth, Rhode Island’s unemployment rate would still be over 10% if people had not stopped looking for work.

RI-laborforceandemp-0107-0614

RIMACT-laborforceandemp-0614perc0107


RI-unemploymentrate-steadyLF-0107-0614

Rhode Island Employment Snapshot, May 2014: The Silent Boom

Rhode Island’s unemployment rate moved down by a notch, rather than a leap, in May, to 8.2%.  However, the 2,659 newly employed Rhode Islanders, according to official Bureau of Labor Statistics (BLS) figures, lead the nation in terms of growth. The downsides of these numbers are that they’re simply difficult to believe and that, even if they’re accurate, the state’s employment situation is still abysmal.

The first chart below illustrates the first downside. If we believe the lines that the government is drawing for us, over 13,000 Rhode Islanders have found employment since December, and we’re back to the employment level of January 2009, after more than five years of wallowing.  Are there any non-statistical signs of this recovery?

The second chart provides a longer-term sense of the results. Rhode Island is still below its employment level just before the jobs-crash of the recession and still lags both of its neighbors dramatically when it comes to reclaiming jobs.  Indeed, Massachusetts has now surpassed its pre-recession peak.

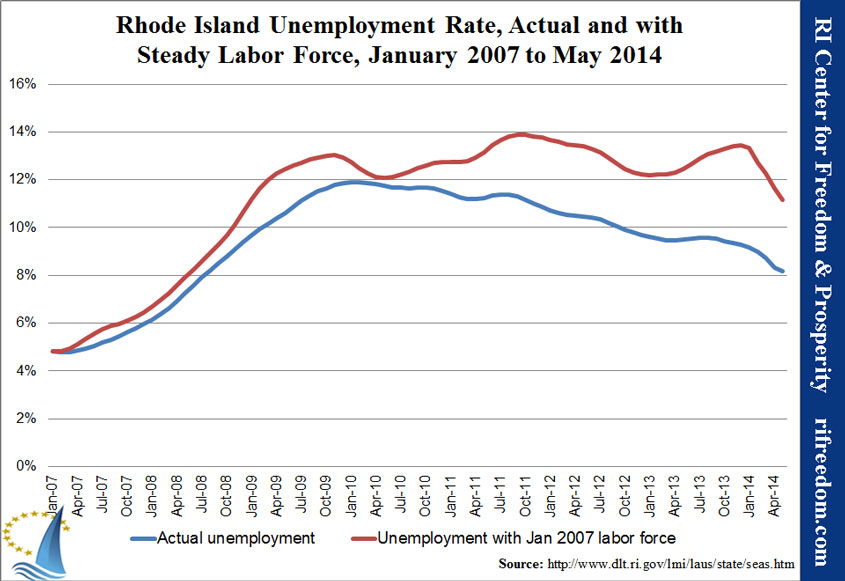
The third chart compares Rhode Island’s unemployment rate with what it would have been if the state’s labor force had held steady. It shows that unemployment never got as low as Rhode Island officials had claimed, and the growth in the gap between the two lines is steadier and more dramatic, with the exception of the peculiar results these past three months.  Even if the results since December reflect real growth, Rhode Island’s unemployment rate would still be over 11% if people had not stopped looking for work.

RI-laborforceandemp-0107-0514RIMACT-laborforceandemp-0514perc0107RI-unemploymentrate-steadyLF-0107-0514

STATEMENT on FY15 BUDGET: Middle Class to Pay for Corporate & Estate Tax Reforms

June 6, 2013
Sales Tax Cut Would Have Larger & More Immediate Impact
Pointing to new broad-based taxes and fees that will especially harm the middle-class, that will also help pay for planned cuts for corporations and high-income individuals, the RI Center for Freedom and Prosperity sees little in the budget that cleared the House Finance Committee yesterday that will aid struggling families and small businesses, in a statement released today.
The Center further urges lawmakers to modify the budget so as to make a more immediate and larger impact on job creation. While noting a that a few items in the proposed budget are a small step in the right direction, the Center notes that the budget also takes backwards steps, and argues that much more needs to be done to boost the state’s struggling economy.

“While the modest corporate and estate tax reforms will be helpful over the long term for those constituencies, we then simultaneously turn-around and add to the plight of the average guy, asking them to pay for those reforms by imposing new vehicle fees and gas and use taxes,” said Mike Stenhouse, CEO for the Center. “Nor does this budget have any bold jobs creation plan. If we also cut the sales tax, we can put money back in the pocket of every Rhode Island family and business, and create thousands of new jobs right away.”

The proposed new gas taxes and fees on vehicle inspections and on good-drivers seeking to clear their traffic records, along with the $2+ million in new sales taxes, will be a direct hit on middle and low income families. The deceptively named “Safe Harbor” for the use tax would impose a new default of 0.08% of adjusted gross income tax on residents’ assumed purchases outside of the state.

The Center does note it as a positive step that the proposed budget did make some cuts that were recommended in its April Spotlight on $pending report, namely: suspension of the historic tax credit program and holding the line on state personnel costs.

The $48 million to pay for a reduction in the sales tax to 3%, that would produce about 13,000 jobs, can be made by eliminating the $12 million payment of the 38 Studio bond, by eliminating the $15 million to the HealthSourceRI UHIP project, by eliminating $11 million in General Assembly legislative and community service grants, and by cutting $19 million in excessive overtime payments, all were recommended cuts in the Center’s spending report.

OTHER NEW TAXES & FEES:

* Article 12 of the budget increases the real estate conveyance tax that a seller of a home or other real estate must pay at the time of transfer.    The current tax is $4.00 per $1000 of the sale price;  the FY2015 budget would increase this tax by 15% and would become $4.60 per $1000 in Rhode Island, higher than Massachusetts tax of $4.56 per $1,000.

Rhode Island Employment Snapshot, April 2014: Increasingly Hard to Believe

Rhode Island’s unemployment rate took another large leap downward, to 8.3%.  The bad news is that the same is true across most of the country, so the Ocean State is still last.  The worse news is that there still doesn’t seem to be much by way of alternative evidence of this boom.

The first chart below illustrates why some healthy skepticism continues to be in order. After many years of general stagnation, February through April 2014 arrive as a sudden ramp, both in employment and in labor force.

The second chart provides a longer-term sense of the results. Rhode Island is still below its employment level just before the jobs-crash of the recession and still lags both of its neighbors dramatically when it comes to reclaiming jobs.  Indeed, Massachusetts is now beyond where it was in January 2007, and almost at its pre-recession peak, which it hit a few months later.

The third chart compares Rhode Island’s unemployment rate with what it would have been if the state’s labor force had held steady. It shows that unemployment never got as low as Rhode Island officials had claimed, and the growth in the gap between the two lines is steadier and more dramatic, with the exception of the peculiar results these past three months.

The chart makes clear that the Ocean State’s unemployment rate would have been much higher, over the past few years, had people not given up looking for work… almost reaching 14% in 2011. It also emphasizes the disturbing trend that the only reason the unemployment rate seems to have been stagnant, rather than increasing, throughout 2013 is that fewer Rhode Islanders are counted at all.

RI-laborforceandemp-0107-0414


RIMACT-laborforceandemp-0414perc0107


RI-unemploymentrate-steadyLF-0107-0414

Rhode Island Employment Snapshot, March 2014: A Boom Without Tremors

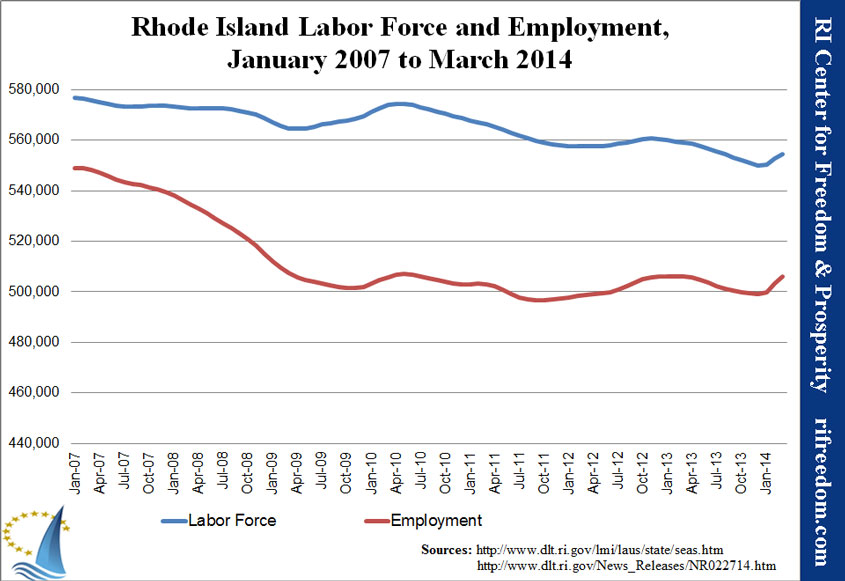
The headline for Rhode Island’s employment picture for March is that the unemployment rate slid all the way down to 8.7% (still last in the nation, though).  You’d be hard pressed to find evidence of this employment boom in the experience of living here, but there it is.

The first chart below illustrates why some healthy skepticism continues to be in order. After many years of general stagnation, February and March 2014 arrive as a sudden ramp, both in employment and in labor force.

The second chart provides a longer-term sense of the results. Rhode Island is still below its employment level just before the jobs-crash of the recession and still lags both of its neighbors dramatically when it comes to reclaiming jobs.  Indeed, Massachusetts is now beyond where it was in January 2007, and almost at its pre-recession peak, which it hit a few months later.

The third chart compares Rhode Island’s unemployment rate with what it would have been if the state’s labor force had held steady. It shows that unemployment never got as low as Rhode Island officials had claimed, and the growth in the gap between the two lines is steadier and more dramatic, with the exception of the peculiar results these past two months.

The chart makes clear that the Ocean State’s unemployment rate would have been much higher, over the past few years, had people not given up looking for work… almost reaching 14% in 2011. It also emphasizes the disturbing trend that the only reason the unemployment rate seems to have been stagnant, rather than increasing, throughout 2013 is that fewer Rhode Islanders are counted at all.

RI-laborforceandemp-0107-0314RIMACT-laborforceandemp-0314perc0107RI-unemploymentrate-steadyLF-0107-0314

Rhode Island Employment Snapshot, February 2014: Still Last

Rhode Island’s employment picture for February gives a positive impression, on first look. Put in the contexts of the past and of the country, however, it’s not quite as sunny.

On the first count, the numbers show a boom in employment, out of nowhere. We’ve seen such results every year for the past several, and they’ve always been followed by significant downward revisions.

On the second count, although Rhode Island was second strongest (after Virginia), the significant increase occurred almost universally across the country — both in states that had been experiencing growth and in states (like Rhode Island) that had been on the downswing.

The first chart below illustrates why a healthy skepticism is in order. After many years of general stagnation, February 2014 arrives as a sudden ramp, both in employment and in labor force.

The second chart provides a longer-term sense of the results. Rhode Island is still below its employment level just before the jobs-crash of the recession and still lags both of its neighbors dramatically when it comes to reclaiming jobs.

The third chart compares Rhode Island’s unemployment rate with what it would have been if the state’s labor force had held steady. It shows that unemployment never got as low as Rhode Island officials had claimed, and the growth in the gap between the two lines is steadier and more dramatic, with the exception of the peculiar results this past month.

The chart makes clear that the Ocean State’s unemployment rate would have been much higher, over the past few years, had people not given up looking for work… almost reaching 14% in 2011. It also emphasizes the disturbing trend that the only reason the unemployment rate seems to have been stagnant, rather than increasing, throughout 2013 is that fewer Rhode Islanders are counted at all.

RI-laborforceandemp-0107-0214

RIMACT-laborforceandemp-0214perc0107

RI-unemploymentrate-steadyLF-0107-0214

Rhode Island Employment Snapshot, January 2014: Dead Last

Rhode Island’s 9.2% unemployment rate is worst in the nation by a half-percentage-point margin.  No other state really comes close.  Worse yet, for the first time since we started tracking these numbers, the Ocean State is the farthest in the union from its pre-recession employment peak.

The first chart below illustrates the story pretty well.  After two years of employment free-fall, Rhode Island experience a little bit of a rebound.  Within six months, however, there began to be no fuel in the recovery, and the labor force responded by beginning its long trend of giving up.  All reduction in the state’s unemployment rate during this period is attributable to people exiting Rhode Island’s economy as workers.

The second chart gives a view of the state’s great distance from peak employment. Both of our neighbors, Massachusetts and Connecticut have seen labor force increases since the beginning of the jobs recession, and both have maintained significantly higher employment

The third chart compares Rhode Island’s unemployment rate with what it would have been if the state’s labor force had held steady. The Bureau of Labor Statistics (BLS) has revised its numbers since the last time we published this chart, but the main differences are that unemployment never got as low as Rhode Island officials had claimed, and the growth in the gap between the two lines is steadier and more dramatic.

The chart makes clear that the Ocean State’s unemployment rate would have been much higher, over the past few years, had people not given up looking for work… almost reaching 14% in 2011. It also emphasizes the disturbing trend that the only reason the unemployment rate seems to have been stagnant, rather than increasing, throughout 2013 is that fewer Rhode Islanders are counted at all.

RI-laborforceandemp-0107-0114

RIMACT-laborforceandemp-0114perc0107

RI-unemploymentrate-steadyLF-0107-1114


Economic Impact of Rhode Island’s Renewable Energy Standard

Download report (PDF)
Executive Summary

In 2004, the State of Rhode Island enacted Renewable Energy Standards (RES) through legislation known as the Clean Energy Act. Many of the assumptions used to justify the Act turned out to be largely inaccurate, and implementation of its mandates will exact more costs to the Rhode Island economy, with only limited benefits, if any.

This study estimates the economic impact of maintaining RES mandates over the next six years in the Ocean State. Rhode Island’s energy prices are already among the highest in the nation, and the state’s poorly rated business climate hardly needs another factor to exacerbate it.[i]

The major findings of this study show:

  • The current energy mandates will raise the cost of electricity by almost $150 million for the state’s consumers through 2020.
  • RI’s electricity prices will unnecessarily rise by an additional 1.85% by 2020.

These increased energy prices will hurt Rhode Island’s residents and businesses and, consequently, inflict harm on the state’s economy. In 2020, the RES is expected to:

  • Increase unemployment in an already-weak
    jobs market.
  • Reduce real disposable income for families.
  • Decrease private investment in the state.
  • Increase the overall energy costs of households, businesses, and industries.

Rhode Island is not alone. Nationally, government mandates that require electric utilities companies to use wind and solar power instead of more-affordable hydrocarbons have left ratepayers with sticker shock in state after state, according to a recent Centennial Institute study.[ii] Average electric rates are 21% higher in the 30 states with mandates than in the 20 states without them, according to expert Kelly Sloan.

Faulty Assumptions

In 2004, at the height of the manmade global warming campaign, a number of assumptions were broadly promoted as reasons for states, our nation, and other countries to enact and implement strict energy guidelines that would limit carbon dioxide emissions into the atmosphere. Nine years later, there are strong arguments to suggest that most of the assumptions that were used as a basis for the energy mandates imposed in Rhode Island were off the mark. The following are among the assumptions that are now openly in dispute:

  • Renewable energy would be more cost-efficient. Renewable energy costs remain significantly higher than conventional sources, with few near-term expectations for change.[iii]
  • Renewable energy would be abundantly plentiful. The inconsistency of wind and solar sources creates significant periods of non-production, often requiring additional fossil-fuel plants to be built as “backup” systems.[iv]
  • Fossil fuel sources would become scarce in the near future. Technological advances, in procurement, transportation, and consumption, continue to expand available energy sources, especially for the United States, which is projected to enjoy an extended, energy-self-sufficient period as the lead producer of oil.[v]
  • Fossil fuels would become increasingly expensive. Coal and natural gas continue to be the least expensive sources of electricity and will continue to be the most cost-efficient sources in the coming decades. As America extracts and refines more and more of its vast reserves, oil prices could also see a significant decline.[vi]
  • Renewable energy would spur a boom in green jobs. There has been no such boom; many once-promising green companies have gone out of business because of low demand for high-priced energy sources. Some European countries that invested heavily in the “green revolution” suffered more job losses than gains.[vii]
  • Renewable energy is better for the environment. This may not be true in the near term. The need for backup power plants decreases environmental efficiency. Better air quality can be achieved via natural gas, which is significantly cleaner than coal.[viii]By contrast, “energy sprawl” has become a popular term among environmentalists to describe the massive amount of land or sea area required for wind or solar farms, which many consider eye pollution.[ix]Furthermore, the miles of transmission lines required for such technology often cut through pristine landscapes,[x]and windmills are a danger to birds and bats.[xi]
  • Global warming is an immediate danger to our Earth. With recent reports that global temperatures have flattened over the past 17 years, despite increasing overall carbon emissions, it is now much more of an open question as to whether or not restrictive and punitive energy mandates will actually make a decisive difference in global temperatures.[xii]

Specific Findings

  • Compliance costs for RI’s RES requirements is already millions of dollars per year and expected to continue climbing, with much of the burden passed on to energy consumers.
  • The intermittent nature of common renewable energy sources means that the standards may not even succeed in their intended purpose of reducing greenhouse gas and other emissions.
  • Rhode Island’s RES mandate will cost Rhode Island $21.4 million per year by 2020.
  • At the end of this decade, electricity prices will be 0.24 cents per kilowatt-hour (kWh) higher because of the RES.
  • These increases will cost the state 105 jobs and $4.6 million in investment dollars and lower the real disposable income by $33.0 million.

Deepwater Wind

The additional negative economic projections related to the implementation of the Deepwater Wind project are not included in these findings. The purpose of this report is to project the general adverse effects of continuing with existing RES mandates; the Deepwater project represents a specific choice to implement one or more of those mandates.

The RI Center for Freedom & Prosperity plans to run the estimated $350–500 million in additional costs to ratepayers through its RI-STAMP modeling tool and release those projections in the coming weeks. It is reasonable to expect the negative effect of this single, specific project to be significantly larger than the general effect of existing RES policies.

Policy Recommendations

Given the shifting landscape of the climate change debate and unchanging condition of Rhode Island’s economy, the question for Rhode Islanders is whether or not the state should loosen its energy mandate policies. This study shows that, if left unchanged, current policies will indeed cause further harm to our state’s already struggling economy.

Even if recent questions about the true global climate effect of carbon emissions prove unfounded, is it realistic to think that restrictive energy policies in the Ocean State will have any impact at all on the global climate, considering its small geographic and industrial footprint? Or should the state seek to roll back some of the burdens these mandates are projected to impose on families and businesses?

If the General Assembly is willing to consider reform of existing RES laws, our Center recommends:

  • Enact the Electricity Freedom Act, repealing the state’s renewable energy standards (see Appendix B for model legislation).

Require that the state investigate and utilize methods of predicting and tracing the economic effects of renewable energy standards on Rhode Island, prior to renewed implementation.


[i] RI Center for Freedom & Prosperity, “Report Card on Rhode Island Competitiveness,” on which Rhode Island receives a D+ for energy issues overall. <www.rifreedom.org/2013/03/second-year-report-card-lack-of-bold-action-lack-of-improvement/>

[ii] Sloan, Kelly. “Bad Bargain: How Renewable Energy Mandates Pick Your Pocket.” Centennial Institute. 2013. <www.ccu.edu/uploadedFiles/Pages/Centennial_Institute/Policy%20Brief%20No.%202013-3.pdf>

[iii] “Levelized Cost of New Generation Resources in the Annual Energy Outlook 2013.” U.S. Energy Information Administration.  January 2013.  <www.eia.gov/forecasts/aeo/electricity_generation.cfm >

[iv] Vartabedian, Ralph. “Rise in renewable energy will require more use of fossil fuels.” Los Angeles Times. December 9, 2012. < articles.latimes.com/2012/dec/09/local/la-me-unreliable-power-20121210>

[v] Smith, Grant. “U.S. to Be Top Oil Producer by 2015 on Shale, IEA Says.” Bloomberg. November 12, 2013. http://www.bloomberg.com/news/2013-11-12/u-s-nears-energy-independence-by-2035-on-shale-boom-iea-says.html

[vi] Ibid at note 3.

[vii] Green, Kenneth P. “The Myth of Green Energy Jobs: The European Experience.” American Enterprise Institute Energy and Environment Outlook. February 2011. < www.aei.org/article/energy-and-the-environment/the-myth-of-green-energy-jobs-the-european-experience>

[viii] De Gouw, J.A., D. D. Parrish, G.J.Frost, and M. Trainer. “Reduced Emissions of CO2, NOx and SO2 from U.S. Power Plants Due to the Switch from Coal to Natural Gas with Combined Cycle Technology.” Earth’s Future. < onlinelibrary.wiley.com/doi/10.1002/2014EF000196/abstract>

[ix] Galbraith, Kate. “Study Warns of ‘Energy Sprawl’.” The New York Times. August 26, 2009. <green.blogs.nytimes.com/2009/08/26/study-warns-of-energy-sprawl/?_r=0>

[x] Wood, Daniel B. “Green power may ruin pristine land in California.” The Christian Science Monitor. April 24, 2007. <www.csmonitor.com/2007/0424/p02s01-wogi.html>

[xi] Irfan, Umair. “Bats and Birds Face Serious Threats From Growth of Wind Energy.” The New York Times. August 8, 2011. < www.nytimes.com/cwire/2011/08/08/08climatewire-bats-and-birds-face-serious-threats-from-gro-10511.html?pagewanted=all>

[xii] Hollingsworth, Barbara. “Climate Scientist: 73 UN Climate Models Wrong, No Global Warming in 17 Years.” CNS News. September 30, 2013. < www.cnsnews.com/news/article/barbara-hollingsworth/climate-scientist-73-un-climate-models-wrong-no-global-warming-17>

Download report (PDF)