Download PDF
Read the first report in this three-part series here … “Will RIers Purchase Insurance Under Obamacare?”
Read the Part-3 report, Moving Forward with Healthcare in RI
Summary
Arranging for health care is one of the most personal and important decisions any of us can make. Across Rhode Island, families and individuals are seeking access to a wide range of affordable health care options that will provide them with peace of mind, health security, and the financial freedom that will enhance their overall quality of life.
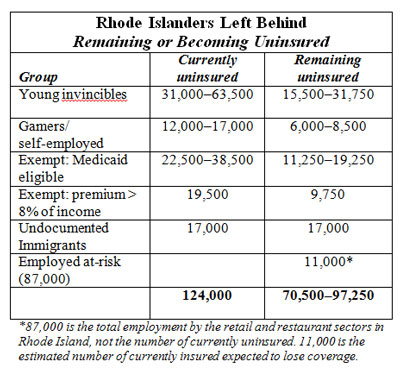
However, the number of Rhode Island residents expected to remain uninsured after implementation of the President’s Affordable Care Act (ACA) could range from over half to up to three-quarters of the currently uninsured population of 124,000, or approximately 70,000–97,000 people in the state.
Consistent with findings from other government and national studies, “Left Behind by Health Reform in RI” further breaks down these figures by identifying the specific groups of people in the Ocean State who are likely to remain without insurance, whether privately owned, subsidized via the state exchange, or via Medicaid.
Despite state government efforts in the past to increase health insurance coverage, the uninsured population has steadily risen over the past decade. So it should come as no surprise that yet another government-centric approach to healthcare, such as the ACA, will not achieve the “near universal” results it was broadcast to produce.
The Center previously published a report (Will Rhode Islanders Purchase Insurance Under Obamacare?) that identified the broad financial disincentives for a significant number of Ocean State individuals and families to obtain private health insurance under ACA and its health benefits exchange. For these and other reasons described in this report, large numbers of Rhode Islanders will continue to lack access to adequate health services.
The summary table below identifies and quantifies the subpopulations of residents in Rhode Island that are expected to continue to include large numbers of uninsured. Detailed discussion of each group is provided in the body of the report.
The RI Center for Freedom & Prosperity recommends that public officials in Rhode Island should not sit back on their hands and expect implementation of ACA alone to provide sufficient reform to the state’s health care system to adequately ensure that all residents of the state have access to affordable, quality care. Indeed, our state must not forget about those who will be left behind by ACA. State officials are encouraged to seek additional remedies to address this pending shortfall.
It is not feasible that a government-centric approach can take into account all of the complexities of the vast private healthcare market, or that a one-size-fits-all solution can adequately address the needs of a highly diverse population, as described in this report. Differing financial circumstances and widely varying personal motives for distinct populations cannot be served in this manner. Only a patient-centric, consumer-oriented, free-market approach can solve this riddle.
In this regard, the Center will publish a third report in this health care series that will propose market-based solutions to address the access-to-health-services shortfall… without requiring additional taxpayer funding.
Introduction
The issue of ensuring that all Rhode Islanders have access to affordable, quality health care has long been on the state’s agenda. The state has tried a variety of public policy solutions over the past two decades to address the issue. A few of the measures that have been aimed at reducing the number of uninsured and expanding access to care include:
- Several expansions of RIte Care eligibility, including covering pregnant and post-partum women between 185 and 350% of the federal poverty level (1994), covering children under 250% of the poverty level (three separate expansions in 1994, 1996, and 1997), and children of undocumented immigrants (1999).[i]
- Creation of the premium assistance program RIte Share for Medicaid-eligible persons offered employer-sponsored insurance (2001).[ii]
- Creation of the RI Office of Health Insurance Commissioner in 2004, with a mission to “broaden the accountability of health insurers,” as well as “Protecting consumers… Encourag-ing fair treatment of medical service providers… Ensuring solvency of health insurers… [and] Improving the health care system’s quality, accessibility and affordability.”[iii]
- Creation of the HEALTHpact insurance product, first offered in October 2007, to encourage small businesses to offer insurance to employees.[iv]
Despite these and other efforts, however, the number of uninsured in Rhode Island has steadily risen over the past decade. In 2000, approximately 6.9% of the state’s under-65 population was uninsured,[v] accounting for approximately 62,000 persons.[vi] By 2012, the uninsured rate had climbed to 13.4% of the under-65 population, totaling roughly 124,000 Rhode Islanders.[vii]
Rhode Island was not alone in seeing the number of uninsured persons explode over the past decade. As a result, in 2010 Congress passed and the President signed the Patient Protection and Affordable Care Act (hereinafter called “ACA”), which was proposed as a way of achieving “near-universal” health care coverage.[viii]
The state of Rhode Island has chosen to move forward aggressively to implement the ACA, including setting up a state-run exchange for individual and small-group purchasers,[ix] as well as embracing the expansion of Medicaid that the U.S. Supreme Court made optional for states in its 2012 ruling on the constitutionality of the act.[x]
But even with implementation of ACA, there is likely to remain a substantial number of uninsured persons in Rhode Island and nationally. The question then becomes, what can policymakers in Rhode Island do to ensure that the remaining uninsured are able to access and fund the health care they need?
This “Left Behind by Health Reform in RI” paper assesses this question, first by identifying and describing several specific subpopulations that make up Rhode Island’s 124,000 uninsured persons.
In an upcoming report, the Center will explore several options that Rhode Island’s policymakers, civic leaders, and individual citizens might be able to promote or pursue in order to obtain either health insurance as traditionally understood or alternate health care financing sources. That paper will offer several specific policy recommendations for the state, all of which have the benefit of not adding costs to citizens or the state while generally preserving or expanding individual freedom for residents of Rhode Island.
It is the hope of the RI Center for Freedom & Prosperity that this “Left Behind by Health Reform in RI” paper can stimulate thoughtful discussion about how best to address the substantial number of uninsured residents who are likely to persist in that condition even after implementation of the ACA. By taking a proactive lead on this issue, Rhode Island can become a national leader in health care reform and serve as a model for other states to follow.
Uninsured After ACA
Even after the ACA is fully implemented in 2016,[xi] it is widely expected that a large number of persons will remain uninsured.
While estimates vary, depending on source, the Congressional Budget Office and Congress’s Joint Committee on Taxation anticipate the number of uninsured in America roughly to be cut in half after implementation of ACA, reducing the number of uninsured from 56 million persons to only 30 million after implementation.[xii] If this is accurate, the national uninsured rate would decline to approximately 11%, an improvement from the current 20% estimated rate.[xiii]
For Rhode Island, results would likely be modestly better, owing in large part to having an already lower rate of uninsured as well as a smaller-than-average population of undocumented immigrants. The number of uninsured persons in Rhode Island has recently been estimated to be 124,000, or 13.6% of the state’s under-65 population.[xiv] A paper by the Robert Wood Johnson Foundation estimated that approximately 53,000 Rhode Island residents would remain uninsured after ACA implementation, reducing the rate of uninsured to 5.8%.[xv]
But there is good reason to believe that these projections substantially overestimate the number of people who will gain insurance under ACA, while also underestimating the number likely to lose insurance coverage. The key reasons that the number of uninsured in Rhode Island may not decline as substantially as predicted include:
- The tax penalty for not purchasing health insurance is lower (often much lower) than the expected after-subsidy out-of-pocket premium for purchasing insurance.
- Younger persons are likely to see premiums rise substantially above current rates, pricing many of them out of the market and exempting them from the mandate.
- ACA’s “guaranteed issue” and “community rating” requirements create incentive for relatively healthy youths to delay insurance purchase until they are sicker and older.
- The IRS is limited in its ability to collect the tax penalty for not purchasing insurance, only being permitted to reduce tax refunds.
- Small businesses, which are least likely to offer insurance to employees today, are exempted from the requirement to provide insurance to employees, and tax credits to help with the cost of providing coverage are too small, too complex, and temporary, limiting their ability to expand coverage to employees of small firms.
- Large employers subject to the employer mandate generally already provide insurance to employees, and many of those that do not (particularly in the restaurant and retail industries) are able to shift employees to part-time status to avoid the penalty.
- Even with the penalty, larger firms employing mostly low- and moderate-income employees may find it financially advantageous to terminate coverage and pay the fine rather than paying health insurance premiums.
- Health insurance is considered to be a relatively inelastic good by economists, meaning that a moderately lower out-of-pocket premium payment paired with a weak penalty for not purchasing insurance is unlikely to prompt large numbers of people to purchase insurance.
Subpopulations
Below are several communities and demographic groups that are likely to continue to see relatively high uninsured rates in 2016 and beyond.
Young & Invincible
A large component of the uninsured population is the so-called “young invincibles,” a group that can be generally thought of as healthy and under the age of 35. For this population, often just starting their careers and earning relatively modest incomes, with few health needs and little worry about paying for medical care, health insurance is simply not something they place much value in, especially if premiums are much higher than might be considered actuarially appropriate. One of the primary purposes of the individual mandate in the ACA is to get this relatively young and healthy population who might not ordinarily purchase health insurance to do so, which should bring down premiums for the rest of the population, if successful.
The past experience of the eight states that enacted both guaranteed issue and community rating requirements in their individual health insurance markets in the 1990s strongly demonstrate why such a mandate might be considered necessary: All eight states saw young and healthy policyholders drop coverage as their rates rose beyond actuarially justifiable premiums, leading to higher rates for remaining policyholders, which in turn set off another round of younger and healthier persons (compared to those remaining) dropping coverage, again raising rates for those remaining. This process continued in all eight states, creating a “death spiral” in premiums that did little to lower the number of uninsured (and may in fact have increased the number of uninsured), drove premiums to levels unaffordable for most, and caused most insurers to exit these markets.[xvi]
However, the mandate under ACA is relatively weak, because for most, the cost of paying the tax penalty is less — in many cases, far less — than paying insurance premiums.[xvii] Moreover, the ability of the IRS even to collect the penalty is extremely limited; it is only allowed to reduce tax refunds, and no criminal or civil charges may be filed, nor wages garnished or bank accounts seized.[xviii] It is therefore highly questionable whether much of Rhode Island’s “young invincible” population will in fact purchase insurance.
For example, a young, single person in his or her mid-twenties in Rhode Island with an annual income of $32,000 (279% of federal poverty level) would under ACA be expected to pay approximately $2,850 out of pocket for a “Silver” level plan, compared with a $695 penalty that can very easily be avoided by minimizing overpayments to the IRS.[xix] For many “young invincibles” who value disposable income over insurance benefits they are unlikely to use, the decision to remain uninsured will be an easy and predictable one.
This has significant ramifications, because Rhode Island’s “young invincibles” comprise up to half of the uninsured.[xx] Of 124,000, approximately 31,000 to 63,500 are likely in this “young invincibles” demographic, most of whom will find it a more sensible decision to remain uninsured and pay a modest or negligible penalty.[xxi] This does not include any currently insured Rhode Islanders who might drop coverage as their premiums rise, which could add thousands or even tens of thousands to the number of uninsured.
Gamers
As discovered by the eight states that passed guaranteed issue and community rating laws in the 1990s,[xxii] individuals can “game” the system by waiting to purchase health insurance until such time as they need to obtain relatively expensive health care. This practice drives up the price of insurance, as insurers end up with a covered population that is less healthy than average, and begins another “death spiral” in premiums that actually increases the number of uninsured, significantly raises premiums, and drives insurers from the market.
ACA effectively imposes guaranteed issue and community rating on insurance markets throughout the country, requiring that insurers accept all who apply and that all insured receive the same premium, adjusted only for age, location, and possibly tobacco use. The law also prohibits limitations on the treatment of preexisting conditions.
In an attempt to ensure that “death spirals” do not occur in insurance markets, ACA contains two provisions designed to minimize the incentive to delay obtaining insurance until expensive care is required. The first is the individual mandate, which requires that most persons obtain health insurance or pay a tax penalty. The second permits states and insurers to limit “open enrollment” to a specific period of time, meaning that those opting to remain uninsured run the risk of not being able to immediately obtain health insurance after discovering they need expensive health care.
Despite these provisions, the guaranteed issue, community rating, and preexisting conditions components of ACA still create significant incentives for persons to avoid purchasing health insurance until they feel they need it.
As noted before, the difference between paying for health insurance and paying the tax penalty for remaining uninsured can be substantial. The difference is especially stark at higher income levels. For example, a married couple, both age 37, with two children and annual income of $82,000 (348% of federal poverty level) would face after-subsidy out-of-pocket premiums of approximately $7,788, while the tax penalty for remaining uninsured would be only $2,085 (again assuming it is collected), a difference of $5,703.[xxiii]
Remaining uninsured may represent an attractive option for this family, especially if either spouse is self-employed. Under ACA regulations proposed by the U.S. Department of Health & Human Services, self-employed persons would be eligible to purchase health insurance year-round with no enrollment period restrictions.[xxiv]
Past research on Rhode Island’s uninsured population found that 11.2% of Rhode Island’s non-elderly adult (18–64) uninsured are self-employed,[xxv] and several thousand more uninsured are likely dependents of these self-employed individuals.[xxvi] This suggests that between 12,000 and 17,000 self-employed individuals and dependents are currently uninsured in Rhode Island, possibly more.
For this population, limits on open enrollment would not be an obstacle to obtaining health insurance only when it is needed, and they and their dependents might find it advantageous to remain uninsured knowing that they could reap substantial savings while still having the ability to obtain insurance when they need it.
It should be noted that the self-employed category tends to generally be older. Nearly 69% of Rhode Island’s self-employed are between the ages of 35 and 64.[xxvii]
An additional population beyond the self-employed that may engage in some degree of gaming will be those Rhode Islanders whose employers drop coverage and raise wages and salaries with the expectation that employees can find coverage in the exchange, and who then elect not to purchase coverage until they feel they need it. This group is discussed below in the “At Risk” section.
Exempted
The previous two groups described were assumed to be subject to the penalty tax of ACA, and that this factor is likely to weigh in the decision-making process of uninsured individuals considering the purchase of health insurance. For the following two groups, however, this is not the case: They are effectively exempted from the law’s requirement to obtain coverage, and for them, the decision to remain uninsured is likely to be an easier one.
The first group are those earning less than 100% of the federal poverty level or who earn 138% or less of federal poverty level and do not have access to affordable employer-sponsored insurance. This population is eligible for Medicaid and can sign up at any time. Nearly half of Rhode Island’s uninsured population is under 139% of the federal poverty level,[xxviii] and most would be eligible for coverage under the Medicaid expansion in which the state has opted to participate. (RiteCare already extends eligibility beyond what current federal law requires, including to parents with children under 18 and family income of 175% of the federal poverty level.)[xxix] This group is exempt from the mandate, and those in it do not have to pay a penalty if they don’t enroll.
Not all Medicaid-eligible persons enroll. Analysis by the Urban Institute found that approximately 13,000 adults in Rhode Island are currently uninsured and eligible for Medicaid.[xxx] An additional 9,500 children are estimated to be uninsured but eligible for either Medicaid or Children’s Health Insurance Program (CHIP) under current eligibility standards.[xxxi] Some of these may enroll as a result of publicity surrounding implementation of ACA, or if the enrollment process becomes less complex. But many are likely to remain uninsured as they are now.
In addition, an estimated 38,000 adults[xxxii] in Rhode Island will become newly eligible for Medicaid under ACA,[xxxiii] many of whom are unlikely to enroll. The Congressional Budget Office estimates that only 57% of newly eligible persons will enroll in Medicaid,[xxxiv] which would leave more than 16,000 Rhode Island adults uninsured in addition to those currently eligible adults and children who are not enrolled in Medicaid.
The other group exempted from the mandate to purchase health insurance is individuals and families who would have to pay premiums in excess of 8% of their income.[xxxv] This group will largely be composed of those with incomes above 400% of the federal poverty level, who would have to pay the full, unsubsidized premium in order to purchase health insurance. According to U.S. Census data, approximately 391,000 Rhode Islanders (including dependents) have a household income of greater than 400% of the federal poverty level,[xxxvi] about $44,680 for an individual or $92,200 for a family of four.[xxxvii]
The rate of uninsured among this higher-income segment of the population is significantly better than for the rest of the population — approximately 5%, nationally.[xxxviii] This figure is generally consistent with Rhode Island’s past findings on the income levels of the uninsured, which found that 12.8% of the uninsured had incomes above 400% of the poverty level,[xxxix] and suggests about 19,500 uninsured Rhode Islanders have relatively high incomes.
Not all of these will be exempt from the mandate, particularly at younger ages. But assuming “Bronze” level premiums of $4,636 for a 55 year old,[xl] individuals between approximately $46,000 and $55,500 (400 and 483% of the poverty level) will be exempt from the mandate because their premiums would exceed 8% of income and be considered “unaffordable.”
The exempt range for couples and individuals is even greater by age and income. A couple aged 54 would be exempt if their combined income were between $62,000 and $111,000, while a family of four with 44-year old parents and incomes between $92,200 and $105,600 would be exempt from the mandate to purchase insurance.[xli], [xlii]
The effects of this exemption is likely to be concentrated among the older uninsured because they face higher premiums and are more likely to earn higher incomes. Because of this broad exemption, it is likely that very few of Rhode Island’s estimated 19,500 high-income uninsured will purchase insurance, and many more currently insured may in fact drop coverage knowing they can obtain it at a later date if faced with significant health care expenses.
Undocumented Immigrants
There is little dispute over the fact that the ACA does not meaningfully address the high number of uninsured among the community of undocumented immigrants. Various provisions of the law, as well as current Medicaid law, specifically prohibit most undocumented immigrants from obtaining any health benefits, such as by enrolling in Medicaid,[xliii] receiving tax credits through the exchange to lower out-of-pocket premium costs, or even purchasing unsubsidized insurance through the exchange.
While the exact number of undocumented immigrants in Rhode Island is not known, most estimates put the number at around 30,000.[xliv] Nationally undocumented immigrants have been estimated to have an uninsured rate of 57%,[xlv] while the combined population of legal noncitizens and undocumented immigrants have an estimated rate of 45%.[xlvi] Noncitizens (both legal and undocumented) are estimated nationally to comprise approximately 22% of the uninsured.[xlvii]
All told, these estimates suggest that at least 17,000 Rhode Island residents, and possibly more, are currently uninsured and will remain so after full implementation of the ACA in 2016.
At Risk
Another group that must also be considered includes those who are currently insured, but who may actually lose their coverage as a result of certain provisions embedded in the ACA.
Under ACA, employers with fewer than 50 full-time employees are exempt from the requirement to make health insurance available to their workers. For businesses with 50 workers or more, there is a $2,000-per-employee penalty for not providing insurance to workers. For most Rhode Island businesses with 50 or more employees, the requirement would not impose a new burden, as these firms already provide insurance to full-time and even some part-time workers.[xlviii]
However, in the face of continued rising health care costs and a relatively modest penalty (compared to health insurance premiums) of $2,000 per employee combined with generous subsidies through the exchange for low- and middle-income workers, it is likely that some employers will choose to stop offering health insurance, pay the penalty, and increase employee compensation directly to offset the loss of health benefits. Some estimates predict modest increases in employer-sponsored insurance coverage,[xlix] but most conclude that there will be a net decrease in the number of Americans receiving health insurance from their employer for these and other reasons.[l], [li]
One industry in which there may be pressure to eliminate or reduce eligibility for employer sponsored health insurance is the restaurant industry, especially if premiums continue to rise as expected even after full implementation of the ACA. Several national restaurant chains or their franchisees have announced in response to the employer mandate that they are likely to limit employees to part-time status in order to avoid the penalty, and others will likely follow.[lii] The restaurant industry has expressed considerable concern about implementation of ACA on behalf of both small and large employers in the industry.[liii]
Restaurants typically operate with a relatively slender 4–6% profit margin,[liv] and according to the National Restaurant Association between 54% and 79% of restaurant workers are uninsured.[lv] Because of such slim margins, considerable flexibility in being able to keep employees at part-time status, and the fact that most restaurant workers are relatively low-income and young, it is highly likely that few restaurant owners will add health benefits, and many that currently offer insurance will consider dropping coverage.
The retail industry faces a similar situation to restaurants. There are more than 87,000 Rhode Islanders in the restaurant and retail industries,[lvi] many of whom are currently uninsured and unlikely to gain employer coverage under ACA and some of whom are currently insured and at risk of losing their employer coverage. The average estimate for three major studies of the number of Americans likely to lose employer coverage is 3.3 million,[lvii] while the most recent Congressional Budget Office estimate pegs the number of persons losing employer-provided coverage at 7 million.[lviii] Using this range, between 11,000 and 24,000 Rhode Islanders will likely lose the employer coverage they currently have.[lix] Many are likely to obtain coverage through the exchange, but others are likely to “game” the system, delaying purchasing insurance until they fall ill or are injured, or as members of the “young invincibles” decide to take any extra compensation they receive upon the loss of employer-sponsored insurance and spend it on things other than health insurance.
Conclusion
It is difficult to predict with any certainty how many Rhode Islanders will remain uninsured after full implementation of the Affordable Care Act in 2016. It should be pointed out that there is substantial overlap among several of the groups described above: Some “young invincibles” are likely also undocumented aliens, and some of the self-employed are also likely exempt from the mandate to purchase insurance because their incomes fall in the range at which unsubsidized premiums exceed 8% of income.
An additional factor that prevents any firm estimate of the number of uninsured is that it is impossible to know how many Rhode Islanders will respond to the considerable disincentives embedded in the ACA to immediately purchase health insurance until an illness or injury makes it economically rational to obtain coverage, as well as provisions of the law that substantially increase premiums for younger policyholders.[lx]
Even with these limitations, a broad range of those likely to remain uninsured after full implementation can be estimated. Based on the information described in this report, and using relatively conservative estimates, between 70,500 and 97,000 Rhode Island residents are likely to remain uninsured after full implementation of ACA in 2016,[lxi] which would reduce the uninsured rate to between 7.9 and 10.5%, from the current 13.4%. The bulk of newly insured in Rhode Island are likely to be new participants in the RIte Care program, with relatively modest numbers of previously uninsured gaining coverage through the individual exchange.
Other Papers in This Series
The first paper in this series, published in June, was “Will Rhode Islanders Purchase Insurance Under ObamaCare?” That paper calculated the tax penalty and likely premiums for various age and income groups and concluded that many would have financial incentive not to purchase health insurance.
The Rhode Island Center for Freedom & Prosperity will continue to contribute to this important and highly personal public discussion by publishing one more related paper proposing free-market public policy solutions, as well as private strategies, that can be pursued to address this shortcoming, without requiring any additional taxpayer funding.
For more information, please contact our Center or visit us at www.RIFreedom.org or email info@rifreedom.org.
About the Author
Sean Parnell, an adjunct scholar to the RI Center for Freedom & Prosperity, is president of Impact Policy Management (IPM), a Washington, D.C., area full-service public policy firm, and manages political advocacy projects for free market and limited government causes. Before founding IPM he was president of the Center for Competitive Politics (CCP), a nonprofit advocacy organization focused on defending the First Amendment. Prior to joining IPM Parnell was Vice President of External Affairs at the Heartland Institute.
[button url=”http://www.rifreedom.org/wp-content/uploads/RICFP-PPACA-leftbehind-080513.pdf” target=”_self” size=”small” style=”royalblue” ]Download PDF[/button]
[i] Comments by Christine Ferguson, Director, RI Department of Human Services, “Hindsight and Foresight: Lessons for Getting It RIte,” May 18, 2001 Conference Transcript: “Getting It RIte (Rhode Island)” page 62, available at: http://www.ihps.org/pubs/2001MayConf/RI.pdf
[ii] “Rhode Island’s RIte Share Premium Assistance Program: ESTIMATED SAVINGS, State Fiscal Year 2005” p. 2,
RI Department of Human Services, January 2006, available at: http://www.dhs.ri.gov/Portals/0/Uploads/Documents/Public/RCRS/RS_Savings_Report_06.pdf
[iii] Web site of the Office of the Health Insurance Commissioner, available at: http://www.ohic.ri.gov/AboutUs_Mission.php
[iv] Edward Alan Miller, et. al. “ Rhode Island’s HEALTHpact Plan: Lessons for Small-Group Reform,” p. 1, Robert Woods Johnson Foundation, March 2010. Available at: http://www.rwjf.org/content/dam/web-assets/2010/03/rhode-island-s-healthpact-plan
[v] Jane Griffin, MPH, ‘Profiles and Trends of the Uninsured in Rhode Island – 2005 Update,’ p. 3, Table 1,
RI Medicaid Research and Evaluation Project, October 2006. Available at: http://www.dhs.ri.gov/Portals/0/Uploads/ Documents/Public/Profiles%20and%20trends.pdf; see also Colleen Ryan, MPH, et. al., “Achieving Universal Health Care Coverage in Rhode Island: Where Are the Challenges?” Figure 1, Rhode Island Department of Public Health, March 2002, available at: http://www.health.ri.gov/publications/periodicals/healthbynumbers/0203.pdf
[vi] Based on 18–64 population estimate provided by U.S. Census Bureau, available at: http://www.planning.ri.gov/census/2010/demographic.pdf
[vii] Matthew Buettgens, Mark A. Hall, Who Will Be Uninsured After Health Insurance Reform, p. 8, Table 1, Robert Wood Johnson Foundation, March 2011. Available at: http://www.rwjf.org/content/rwjf/en/research-publications/find-rwjf-research/2011/03/who-will-be-uninsured-after-health-insurance-reform-.html
[viii] See Sara Rosenbaum, ‘The Patient Protection and Affordable Care Act: Implications for Public Health Policy and Practice,’ Public Health Reports, Jan-Feb 2011, “the Act establishes… a near-universal guarantee of access to affordable health insurance coverage,” available at: http://www.ncbi.nlm.nih.gov/pmc/articles/PMC3001814/; see also ‘Health Reform and You: How the Affordable Care Act Expands Health Insurance Coverage,’ Commonwealth Fund, January 9 2013, “the Affordable Care Act will deliver near-universal health coverage to Americans,” available at: http://www.commonwealthfund.org/ Multimedia/Videos/2013/How-the-ACA-Expands-Health-Insurance-Coverage.aspx; see also “America’s Future,” The Lancet, Volume 380, Issue 9853, Page 1531, 3 November 2012, “Obama will continue to implement the landmark Patient Protection and Affordable Care Act (ACA), passed in 2010, which aims for near-universal health-care coverage,” available at: http://www.lancet.com/journals/lancet/article/PIIS0140-6736%2812%2961861-3/fulltext; see also testimony of Christine Ferguson, Director, Rhode Island Health Benefits Exchange, to the U.S. Senate Committee on Finance, February 14, 2013, “We are carrying out our work under five guiding goals. In Rhode Island, we will… Achieve near universal coverage,” available at http://www.finance.senate.gov/imo/media/doc/Director%20Christine%20Ferguson%20Testimony%20-%20U%20S%20%20Senate%20Finance%20-%202%2014%20131.pdf. In addition, Governor Lincoln Chafee’s executive order authorizing the creation of an exchange described the purpose of the act as “Providing near-universal health insurance coverage.” See following note.
[ix] Executive order 11-09 of Governor Lincoln Chafee, ‘Establishment of the Rhode Island Health Benefits Exchange,’ September 19, 2010, available at: http://www.governor.ri.gov/documents/executiveorders/2011/Executive_Order_11-09.pdf
[x] “A Guide to the Supreme Court’s Affordable Care Act Decision,” p. 5, Kaiser Family Foundation, July 2012, available at: http://www.kff.org/healthreform/upload/8332.pdf
[xi] The author considers 2016 to be the first year of “full implementation” for ACA because it is the first year the penalty tax for not obtaining health insurance is at its full level. The penalty tax is considered to be the key to getting many of the uninsured to purchase coverage.
[xii] Estimates for the Insurance Coverage Provisions of the Affordable Care Act Updated for the Recent Supreme Court Decision, p. 20, Table 3, Congressional Budget Office, July 2012. Available at: http://www.cbo.gov/sites/default/files/cbofiles/attachments/43472-07-24-2012-CoverageEstimates.pdf
[xiv] Matthew Buettgens, Mark A. Hall, Who Will Be Uninsured After Health Insurance Reform, p. 8, Table 1, Robert Wood Johnson Foundation, March 2011. Available at: http://www.rwjf.org/content/rwjf/en/research-publications/find-rwjf-research/2011/03/who-will-be-uninsured-after-health-insurance-reform-.html
[xvi] For a full account, see: Destroying Insurance Markets by Conrad Meier, published by the Council for Affordable Health Insurance and The Heartland Institute, 2005. Full text available at: http://www.cahi.org/cahi_contents/resources/pdf/destroyinginsmrkts05.pdf
[xvii] See Appendix B for an analysis of true out-of-pocket costs v. penalty
[xviii] ‘Technical Explanation of the Revenue Provisions of the “Reconciliation Act of 2010,” As Amended, In Combination With The Patient Protection and Affordable Care Act,’ p. 2 (errata correction), Joint Committee on Taxation, March 21, 2010, which reads: “Although assessable and collectible under the Code, the IRS authority to use certain collection methods is limited. Specifically, the filing of notices of liens and levies otherwise authorized for collection of taxes does not apply to the collection of this penalty. In addition, the statute waives criminal penalties for non-compliance with the requirement to maintain minimum essential coverage. However, the authority to offset refunds or credits is not limited by this provision.” Available at: https://www.jct.gov/publications.html?func=startdown&id=3673
[xix] Calculated using the UC Berkley Labor Center calculator, available at: http://laborcenter.berkeley.edu/healthpolicy/calculator/
[xx] Karen Bogen, Who Are The Uninsured in Rhode Island: Demographic Trends 1990 – 2004, Access to Care, and Health Status for the Under 65 Population, p. 50, Rhode Island Department of Human Services, 2006. According to Bogen, 44% of the uninsured in 2004 were between the ages of 18 – 34. Most young uninsured report themselves as being in “excellent,” “very good” or “good” health, see Ibid at note 8, p. 78, where only 6% of uninsured between age 18 – 39 reported their health status as only “fair” or “poor.” Previous work by Bogen (Who are the Uninsured in Rhode Island, p. 85, Rhode Island Department of Human Services, 2005) find that 57% of Rhode Island’s uninsured consider themselves in “excellent” or “very good” health, significantly below the 72.6% of insured. She notes however that “The uninsured’s self-perception of poorer health may not be based on actual illness prevalence. There are very small differences between the insured and uninsured on reports of asthma, arthritis, disability, depression, and diabetes.” p. 85.
[xxi] The low-end estimate of 31,000 relies on Bogen’s estimates (Ibid at note 23) that 44% of Rhode Island’s 124,000 uninsured are between the ages of 18 and 34, and that 57% of those consider themselves in “excellent” or “very good” health (124,000×0.44x.57). The high-end estimate of 63,500 assumes that Rhode Island’s currently uninsured population closely resembles the more recent national profile of the uninsured and relies on current Census Bureau data (available at: http://www.dlt.ri.gov/lmi/pdf/acs/rhodeisland.pdf) and Centers for Disease Control analysis (available at: http://www.cdc.gov/nchs/data/health_policy/HI_08_to_June11_YoungAdults.pdf), along with Pfizer’s report on the health status of the uninsured (see Ibid at note 19, p. 78). Based on these data the high-end number of uninsured between 18 and 35 in Rhode Island was determined as: (113,562×0.273)+(129,313×0.283)=67,600, which was then multiplied by 0.94 to remove those reporting their health status as “fair” or “poor.” Numbers have been rounded, and adjustments to source data have been made to reflect different reporting ranges in each report.
[xxiv] Patient Protection and Affordable Care Act; Health Insurance Market Rules; Rate Review; Proposed Rule, § 147.104 Guaranteed availability of coverage, p. 70612, Federal Register, Vol. 77, Number 227, November 26, 2012. Available at: http://www.regulations.gov/#!documentDetail;D=CMS-2012-0141-0001
[xxv] See Ibid at note 25, p. 57.
[xxvi] An Analysis of Rhode Island’s Uninsured: Trends, Demographics, and Regional and National Comparisons, Appendix, Office of the Health Insurance Commissioner, State of Rhode Island, September 2007. The appendix pages and tables in the appendix are not numbered, table titled “Uninsured < 65 by Labor Force Status” shows data from both the Rhode Island Health Interview Survey and U.S. Census Bureau Current Population Survey suggesting that 43% of self-employed uninsured are parents, meaning at least one dependent.
[xxvii] Rhode Island Indicators: Aging and Work, p. 8, Center on Aging and Work, Boston College, 2008. Available at: http://www.bc.edu/content/dam/files/research_sites/agingandwork/pdf/publications/states/RhodeIsland.pdf
[xxviii] Rhode Island: Health Insurance Coverage of the Nonelderly (0-64) with Incomes up to 139% Federal Poverty Level, available at: http://www.statehealthfacts.org/profileind.jsp?ind=849&cat=3&rgn=41 Although the law generally specifies expansion up to 133% of FPL, a 5% credit in the law effectively raises eligibility to all with less than 139% of FPL.
[xxix] Web site of the Rhode Island Department of Human Services, at: http://www.dhs.ri.gov/People/FamilieswithChildren/HealthCareCoverage/RIteCare/tabid/213/Default.aspx
[xxx] Genevieve M. Kenney, Lisa Dubay, Stephen Zuckerman, and Michael Huntress, Opting Out of the Medicaid Expansion under the ACA: How Many Uninsured Adults Would not Be Eligible for Medicaid? p. 3, Urban Institute, July 5, 2012. Available at: http://www.urban.org/UploadedPDF/412607-Opting-Out-of-the-Medicaid-Expansion-Under-the-ACA.pdf
[xxxi] “Medicaid Facts: Rhode Island” American Academy of Pediatricians, September 2012, available at: http://www.aap.org/en-us/advocacy-and-policy/federal-advocacy/access-to-care/Medicaid%20Fact%20Sheets/RhodeIsland.pdf
[xxxiii] Because Rhode Island currently extends Medicaid and CHIP eligibility for children up to 250% of FPL, there is no increase in the number of children eligible under ACA.
[xxxiv] John Holahan and Irene Headen, Medicaid Coverage and Spending in Health Reform: National and State?by?State Results for Adults at or Below 133% FPL, p. 36, Kaiser Family Foundation, May 2010. Available at: http://www.kff.org/healthreform/upload/medicaid-coverage-and-spending-in-health-reform-national-and-state-by-state-results-for-adults-at-or-below-133-fpl.pdf. See also Heidi Allen et. al. What The Oregon Health Study Can Tell Us About Expanding Medicaid, August 2010, available at http://www.ncbi.nlm.nih.gov/pmc/articles/PMC3533495/, suggesting a 2008 expansion in Oregon’s Medicaid eligibility resulted in a take-up rate of between 39 and 50%.
[xxxv] Carol A. Pettit and Edward C. Liu, The PPACA Penalty Provision and the Internal Revenue Service, p. 3, Congressional Research Service, April 30, 2010.
[xxxvi] Rhode Island: Distribution of Total Population by Federal Poverty Level, Kaiser Family Foundation. Available at: http://www.statehealthfacts.org/profileind.jsp?ind=9&cat=1&rgn=41&cmprgn=1
[xxxvii] 2012 HHS Poverty Guidelines, U.S. Department of Health & Human Services, available at: http://aspe.hhs.gov/poverty/12poverty.shtml/12fedreg.shtml
[xxxviii] The Uninsured – A Primer: Key Facts About Americans Without Health Insurance, p. 3, figure 2, Kaiser Family Foundation, October 2011. Available at: http://www.kff.org/uninsured/upload/7451-07.pdf
[xxxix] See Ibid at note 25, p. 55.
[xl] See Appendix A for proposed premiums for Blue Cross & Blue Shield of Rhode Island, effective January 1, 2014.
[xlii] The Kaiser Family Foundation performed similar calculations based on national data and CBO estimated “Bronze” level premiums and determined that a family of four with income between $98,000 and $150,000 would be exempt from the mandate. See “The Individual Mandate: How Sweeping?” March 21, 2012, available at: http://policyinsights.kff.org/ 2012/march/the-individual-mandate-how-sweeping.aspx. Similarly, the Office of the Actuary at the Centers for Medicare & Medicaid Services estimated that individuals and families with incomes between 400% and 542%, about 16% of the population, would be exempt from the mandate to purchase insurance because of the affordability standard; see: Richard Foster, “Estimated Financial Effects of the ‘Patient Protection & Affordable Care Act,’ As Amended,” p. 7, Department of Health & Human Services, April 22, 2010.
[xliii] Medicaid does allow for pregnant undocumented immigrants to receive care, including childbirth. Aside from this provision, however, they are effectively barred from receiving any benefits under ACA.
[xliv] Unauthorized Immigrant Population: National and State Trends, 2010, p. 23, Table A3, Pew Hispanic Center, 2011. Available at: http://www.pewhispanic.org/files/reports/133.pdf
[xlv] Stephen Zuckerman, Timothy A. Waidmann and Emily Lawton, Undocumented Immigrants, Left Out of Health Reform, Likely to Continue to Grow as Share of the Uninsured, p. 2000, Exhibit 2, Health Affairs, 30, No. 10 (2011).
[xlvi] Margaret McDonald and Robin P. Hertz, A Profile of Uninsured Persons in the United States, p. 12, published by Pfizer, Inc., 2008.
[xlviii] State-Level Trends in Employer-Sponsored Health Insurance: A State-By-State Analysis, p. 24, Table 10, “Trend in Private Sector Employers Offering ESI, by Firm Size and State,” Robert Wood Johnson Foundation/State Health Access Data Assistance Center (SHADAC), June 2011. The study found that 98.3% of RI firms with 50 or more employees offer health insurance, compared to only 51.5% of firms with fewer than 50 employees. Of firms that offer insurance, the percentage of eligible workers was roughly equal in Rhode Island, at 75.6% for small firms and 76.4% for larger firms (p. 26, table 12).
[xlix] According to a Congressional Budget Office review of studies, microsimulations from the Centers for Medicare & Medicaid Services, RAND Corporation, and Urban Institute showed increases in net employer sponsored insurance of 200,000, 4.2 million, and 4.1 million, respectively. Another analysis by the Employment Policies Institute projected a 4 million net increase in employees receiving insurance through employers. See Patient Protection and Affordable Care Act: Estimates of the Effect on the Prevalence of Employer-Sponsored Health Coverage, pp. 10–12, Congressional Budget Office, July 2012.
[l] Ibid, pp.10–14. Booz & Company projects 3–4 million Americans will lose employer health coverage, the Congressional Budget Office initially predicted a net decrease of 4 million persons, and the Lewin Group estimates 2 million people will lose employer-sponsored coverage. In February 2013, the Congressional Budget Office increased its estimate of the number of persons losing employer-sponsored insurance to 7 million, see note 56.
[li] See, McKinsey & Company – Benefits Package Decision Makers Study, p. 162, February 2011 available at: http://www.mckinsey.com/features/us_employer_healthcare_survey, which found that 26.4% of employers with 50 or more employees would “definitely” or “probably” drop coverage in response to the ACA; see also Douglas Holtz-Eakin and Cameron Smith, “Labor Markets and Health Care Reform: New Results,” p. 5, American Action Forum, May 27, 2010, available at: http://americanactionforum.org/files/LaborMktsHCRAAF5-27-10.pdf, which finds that up to 35 million Americans are at risk of losing employer-sponsored coverage under ACA; see also “HR Policy Association: 2011 Annual Chief Human Resource Officer Survey,” available at http://www.hrpolicy.org/downloads/2011/CHRO%20Report%20Draft_FINAL%20REORDERED_HC%20Only.pdf, in which 6% of HR department heads said their companies would “give serious consideration to discontinuing providing health care benefits.”
[lii] See Jessica Lipscomb, “John Schnatter Papa John’s CEO: Obamacare likely to raise costs, employee’s hours being cut,” NaplesNews.com, November 8, 2012, available at: http://www.wptv.com/dpp/news/state/john-schnatter-papa-johns-ceo-obamacare-likely-to-raise-costs-employees-hours-being-cut; see also “Applebee’s targeted after franchisee mulls hiring freeze in response to Obamacare,” Twitchy.com, November 9, 2012, available at: http://twitchy.com/2012/11/09/applebees-targeted-after-franchisee-mulls-hiring-freeze-in-response-to-obamacare/; see also Julie Jargon, “Chili’s Feels Heat to Pare Costs” Wall Street Journal, January 28, 2011, available at: http://online.wsj.com/article/SB10001424052748704307404576080340742759346.html#articleTabs%3Dcomments
[liii] “Regulatory comments of the National Restaurant Association,” p. 2, October 31 2011, available at http://www.restaurant.org/pdfs/advocacy/20111031_hcr_irs_hhs_nra_sra_comments.pdf
[liv] Ibid. See also “A Better Approach to Government Business Mandates,” p. 4, The Profit-Per-Employee Coalition, October 2011, available at: http://profitperemployee.com/yahoo_site_admin/assets/docs/PPE_OVERVIEW_OCT_2011.264154218.pdf, which found that the restaurant and hospitality association had average profits per employee of only $754 annually, well below the all-industry average of $10,252.
[lv] Information contained in news release from National Restaurant Association, May 21, 2010, available at: http://www.restaurant.org/pressroom/pressrelease/?id=1959
[lvi] U.S. Bureau of Labor Statistics, available at: http://www.bls.gov/oes/current/oes_77200.htm#35-0000. The numbers show nearly 53,000 employees in the restaurant industry and approximately 34,000 cashiers and retail sales workers.
[lvii] Ibid at note 49, pp. 10–12. The Congressional Budget Office originally estimated 4 million Americans would lose coverage, the Lewin Group estimated 2.4 million, and Booz & Company estimated 3–4 million. While other studies reviewed in this paper estimate increases in employer provided insurance (RAND, Urban Institute, Centers for Medicare & Medicaid Services), the author believes these studies do not account for the significant incentives that employers, particularly in low-wage industries with considerable scheduling flexibility such as restaurants and retail outlets, will face once ACA is implemented. In particular, the exemption of employers with fewer than 50 employees, the complex, temporary, and relatively modest subsidies available to small employers, and the fact that the penalty for not providing insurance is in many cases less than the cost of providing insurance, all combine to reduce the likelihood of employers’ being willing to offer coverage that was previously not provided, and increase the likelihood that employers will drop coverage. This view is also supported by the results of several surveys of employers (see Ibid at note 49), and numerous anecdotal accounts in the media of employers considering reducing or dropping the availability of health insurance for employees (see Ibid at note 50).
[lviii] The Budget and Economic Outlook: Fiscal Years 2013 to 2023, p. 60, Table A-2, Congressional Budget Office, February 2013, available at: http://www.cbo.gov/sites/default/files/cbofiles/attachments/43907-BudgetOutlook.pdf
[lix] Author’s calculation, based on Rhode Island’s population comprising 0.341% of the U.S. population. Source: http://quickfacts.census.gov/qfd/states/44000.html. Numbers have been rounded to the nearest 1,000.
[lx] See Alex Nussbaum “Aetna CEO Sees Obama Health Law Doubling Some Premiums,” Bloomberg, Dec 13, 2012, available at http://www.bloomberg.com/news/2012-12-12/aetna-ceo-sees-obama-health-law-doubling-some-premiums.html; see also Jonathan Block, ‘Young Americans Could Experience Shock When Exchanges Go Live,’ AISHealth.com, December 7, 2012, available at: http://aishealth.com/blog/health-reform/young-americans-could-experience-shock-when-exchanges-go-live; see also Miles Miller, ‘Obamacare architect: Expect steep increase in health care premiums,’ Daily Caller, February 11, 2012, available at
http://dailycaller.com/2012/02/11/obamacare-architect-expect-steep-increase-in-health-care-premiums/#ixzz2KoXv8dfh
[lxi] These are conservative estimates based on adding the total number of ‘Undocumented Immigrants’ persons to .5 of both the high and low estimates for the “Young Invincibles,” “Self Employed,” “Exempt – Medicaid,” “Exempt – 400%+ FPL” and taking the low end of the “At Risk” estimate.