Dead State Walking

So Reuters reports that Jefferson County Alabama has filed for backruptcy becase of an usupportable $5,000,000,000 debt.  With 660,000 people in the county that’s about $7500 in debt per person.

Rhode Island has somewhere in the vicintiy of $30,000,000,000 in debt when you include the (true) penson liability ($18B) , the infrastructure debt ($9B), the ‘OPEB’ liablities ($??B), and whatever else we’ve yet to identify.  That’s probably well north of $30,000 of debt per person.

If we have four times the per capita debt load and they’re bankrupt, what does that make us?


Small Pensions; Double (and Triple) Dipping

The Significance of Small Pensions

In the public debate about suspending cost of living adjustments (COLAs) for retirees holding public-sector pensions, the most compelling argument addresses retirees whose income would drift below the poverty level as inflation erodes their pensions’ value.  It’s important to adjust one’s reaction, however, to account for the variation in individual circumstances.  One cannot assume, that is, that each pension is the sole source of income (even sole pension) for the retiree.

Take the pensioners in the Municipal Employees Retirement System (MERS), which the state administers and which has the lowest average gross pension (including COLAs) among the state’s various plans.  According to data available on RIOpenGov.org, the average for the 3,972 pensions in the municipal system is $13,285 per year.  Of those, 59 pensions are worth less than $1,000 per year — clearly not sufficient as a sole source of income; that’s 1.5% of MERS pensions, and it reduces the average by $192.

Expanding the range to include all pensions under $5,000 — still not enough to be more than supplemental income — brings the total to 799 pensions. Excluding them from the equation — on the grounds that we’re interested in the plight of retirees who live on their pensions alone and therefore cannot be made to suffer COLA suspensions — brings the average MERS pension up to $15,842, which is 45% greater than current poverty guidelines for an individual.

That still isn’t a great deal of money, but the relevant point is that many of these pensions are so small that it isn’t reasonable to present them as the retiree’s livelihood. Among all retirees, the average gross pension is approximately 71% of the final average salary that the person earned while working. That means that a pension of $5,000 would result from an employee’s pay of $7,000; such employees surely had other resources while working and may very well in retirement, too.

Unfortunately, payroll information for public employees has only been readily available to the public for a few years; it often isn’t descriptive of the working capacity of the employee; and very few retirees with low pensions retired recently. That last point, in itself, is very interesting: Among all 26,598 retirees, the average date of retirement is July 1998. For those with pensions under $10,000, it’s August 1994; under $5,000, January 1992; and under $1,000, October 1994. In general, and despite COLAs, those with the smallest pensions have been retired for longer. It would require extensive research to confirm, but the impression given is of the bad old days when pensions were easy rewards to give for minimal service.

Double/Triple Dipping

In some cases, the additional income for retirees derives from additional pensions. Of the 26,598 pensions on the state’s books, 1,195, or 4.5%, go to former employees who have more than one, and the average combined pension for these 574 individuals is $48,911. Five hundred and twenty nine have two pensions; forty-five have three.

(Identity was determined by full name, including middle initial or lack thereof, year of birth, and current city of residence.  Also note that these totals include individuals  who also receive “teacher survivor benefits” as a pension in lieu of similar provisions in Social Security, as well as retirees who receive pensions as “beneficiaries” but are not the original “owners” of them.)

In the interest of privacy, it’s preferable to discuss pensions in aggregate terms, but in this particular case, it’s impossible to convey a sense of things without pointing to at least a few specific examples. For that purpose, here are the twenty highest-paid retirees whose totals involve more than one pension:

Top 20 Retirees with Multiple Pensions, 2010
Age at Retirement Former Employer Year of Retirement Gross Pension 2010 ($)
Carmine DiPetrillo
$164,795
67
Legislators (O)
1994
12,252
67
State Police Judge – Family Court (O)
1994
152,543
Peter O’Connell
$134,907
69
State Police Judge (O)
1990
92,776
72
State (O)
1993
42,131
Deborah Jones
$130,926
50
Cumberland School Dept. (B)
2002
40,083
50
TSB
2002
22,500
56
Cumberland School Dept. (O)
2008
68,343
Elizabeth Vendituoli
$130,598
54
Bristol Warren Reg. School Dist. (B)
2005
42,401
54
TSB
2005
22,500
55
Bristol Warren Reg. School Dist. (O)
2006
65,697
Mary McCabe
$127,781
43
State (B)
1984
44,940
63
State (O)
2004
82,841
Audrey Carnevale
$125,330
47
Legislators (B)
2000
9,501
47
State (B)
2000
68,498
52
State (O)
2005
47,331
Robert Gerus
$124,520
60
Cumberland School Dept. (B)
2003
35,989
60
TSB
2003
17,930
61
State (O)
2004
70,601
Clifford Cawley
$121,082
59
Legislators (O)
1987
19,896
59
State Police Judge – Superior Court (O)
1987
101,186
Vincent Cullen
$120,542
55
Cranston School Dept. (B)
1989
4,667
55
TSB
1989
16,137
68
State (O)
2002
99,738
Samuel Greenstein
$120,246
57
Providence School Dept. (B)
2002
42,527
57
Providence School Dept. (O)
2002
77,719
Marcia Clifford
$118,956
38
State Police Judge (B)
1987
56,229
52
State (O)
2001
62,727
Susan Browning
$116,254
53
Providence School Dept. (O)
2001
57,996
54
Coventry Public Schools (B)
2002
42,388
54
TSB
2002
15,870
Livia Giroux
$112,609
48
Smithfield School Dept. (B)
1990
33,534
48
TSB
1990
13,500
62
West Warwick School Dept. (O)
2004
65,575
Francine Gonnella
$109,369
63
Judges – Superior Court (B)
2007
34,666
63
Providence School Dept. (O)
2007
74,703
Rita Munzer
$107,113
63
Warwick School Dept. (O)
1983
29,936
66
State (B)
1986
55,896
85
State (B)
2005
21,281
Geraldine Guglielmino
$106,838
63
State (B)
1998
39,156
64
State (O)
1999
67,682
Sydney Williams
$106,371
58
Newport School Dept. (O)
1986
64,752
63
Newport School Dept. (B)
1991
23,689
76
TSB
2004
17,930
Gladys Thomas
$105,769
53
State (B)
1989
34,887
61
State (O)
1997
70,882
Nancy Cunningham
$104,988
58
State (B)
1989
69,074
59
North Kingstown School Dept. (O)
1990
35,914
Marcella Delnero
$102,464
59
State Police Judge – District Court (B)
1988
49,997
61
Newport School Dept. (O)
1990
52,467
Notes:
“O” = owner
“B” = beneficiary
“TSB” = Teacher Survivor Benefit
Identity was determined by full name, including middle initial or lack thereof, year of birth, and current city of residence.


The Individual Stories

Sifting through the pension list in order to understand the decisions behind the numbers is fascinating, but time consuming — not the least, as noted above, because the available data is sparse, recent, and incomplete.

For example, trying to figure out the lives and deals behind the very low pensions, one might come across John Marchant, who receives $609 per year based on work with the Town of Scituate. He appears to have “retired” in September 2007, so he shows up on a payroll filing from that town available on The Money Trail, showing his pay as $2,000, without description of his job. Another angle comes into view with Joseph F. Cassidy, who receives $333 annually for a non-teaching role in the Pawtucket School Dept., which he left in 1979. An Internet search for Mr. Cassidy turns up an RI House resolution from June 2010 congratulating his son upon his retirement as Director of Planning and Redevelopment for the City of Pawtucket.  (The pension rolls are full of repeated last names.)

The double- and triple-dip pensions are even more intriguing but require some delicacy, because the better part of them appear to involve a deceased spouse. Deborah Jones, for instance, has been receiving a pension as a “beneficiary” and a TSB since 2002, totaling $62,583. She then retired from the same district, adding another pension in 2008. The payroll for her final year has her receiving $73,334 as a substitute teacher.

None of this should be taken as evidence of wrongdoing on the individuals’ part. Behind the pension statistics are people trying to make the best decisions that they can as they deal with the unpredictable events and opportunities of life.  But as Rhode Island’s retirement system devolves into further crisis and state officials come forward with proposals to resolve (or at least postpone) it, honest assessment and tough judgment are the order of the day.

After all, behind the “employer contributions” are taxpayers struggling to get by in an atrophied economy while public decision makers treat retirements that are both long and lavish by private-sector standards as inviolable commitments.

Retirees, the Young and the Wealthy

The two categories listed in the title of this post are meant to be separate.  From some folks’ point of view, Rhode Island’s retirees are both young and wealthy, as a group, but with this post, my intention is to take a look at age at retirement and the dollar amount of gross pensions as separate topics.

Regarding the first, the average retirement age of the 26,598 included in the database that the Employees’ Retirement System of Rhode Island (ERSRI) provided to RIOpenGov.org was 58 — with an average gross pension of $33,388 and years retired of 13.  Of course, different careers tend to come to retirement at different ages, and Rhode Island’s many public employers vary in their generosity.

As is to be expected, police, fire, and rescue departments lead the list of youngest retirees, with the following top 20:


Top 20 Rhode Island Police, Fire, & Rescue
Departments by Age at Retirement
Number of Retirees Average Age at Retirement Average Gross Pension ($) Average Years Retired
Harris Fire & Light Dist. 1 30 24,345 12
Hopkins Hill Fire Dept. 1 42 20,829 2
Richmond Police Dept. 1 42 26,392 9
Woonsocket Fire Dept. 12 42 25,378 5
Cranston Police 8 43 41,956 6
Woonsocket Police Dept. 52 44 32,490 5
Cumberland Rescue 4 44 20,003 7
Smithfield Police Dept. 3 44 24,232 13
New Shoreham Police Dept. 2 45 36,762 6
Cranston Fire 5 46 39,192 3
Lincoln Rescue 6 46 20,556 6
Washington Fire District 1 46 30,622 11
State Police 4 46 63,501 6
Coventry Fire Dist. 7 46 33,822 6
Johnston Firefighters 2 47 35,981 4
Charlestown Police Dept. 11 47 32,858 9
North Smithfield Fire & Rescue Services 5 47 31,819 7
Tiogue Fire Dist. 2 48 19,216 18
Burrillville Police Dept. 9 48 28,660 14
North Kingstown Police Dept. 30 48 33,592 8


Teachers begin retiring a few years later:

Top 20 Rhode Island Teacher Groups by
Age at Retirement
Number of Retirees
Average Age at Retirement
Average Gross Pension ($)
Average Years Retired
BEACON Charter School of Woonsocket
1
52
38,954
12
Charlestown Teachers
2
55
15,954
30
Johnston School Dept.
215
55
43,505
13
Tiverton School Dept.
161
55
41,322
13
West Warwick School Dept.
275
56
45,431
11
Smithfield School Dept.
173
56
41,023
13
Chariho Regional School Dist.
248
56
40,728
11
East Providence Schools
479
56
45,030
12
Northern Rhode Island Collaborative
10
56
38,481
7
Coventry Public Schools
325
56
47,098
13
Central Falls Collaborative
166
57
44,896
10
Narragansett School Dept.
123
57
40,643
10
Lincoln School Dept.
193
57
45,148
13
Bristol Warren Reg. School Dist.
296
57
41,421
13
Pawtucket School Dept.
632
57
43,330
12
Woonsocket School Dept.
469
57
42,289
12
Portsmouth School Dept.
211
57
43,065
12
North Providence School Dept.
251
57
46,787
11
Newport School Dept.
363
57
41,593
14
Cranston School Dept.
769
57
44,425
13


Switching to rankings of retirees by the amount of their pensions, Superior Court leads the list:

Top 20 Rhode Island Public Employers by
Average Gross Pension
Number of Retirees
Average Age at Retirement
Average Gross Pension ($)
Average Years Retired
Judges-Superior Court
10
70
104,264
5
Providence 12 month bi-weekly (teachers)
22
57
71,620
7
Coventry Lighting Dist.
1
80
68,834
5
State Police Judge
317
49
68,171
20
State Police
4
46
63,501
6
Narragansett School Dept./Adm.
5
59
62,731
6
Barrington Fire Dept. (25 Plan)
1
57
50,657
8
East Greenwich Hsg. Auth.
1
66
49,646
3
Coventry Public Schools
325
56
47,098
13
North Providence School Dept.
251
57
46,787
11
West Warwick School Dept.
275
56
45,431
11
Lincoln School Dept.
193
57
45,148
13
East Providence Schools
479
56
45,030
12
Central Falls Collaborative
166
57
44,896
10
Warwick School Dept.
980
57
44,598
14
Cranston School Dept.
769
57
44,425
13
Cumberland School Dept.
334
57
43,614
12
R.I. Airport Corporation
22
57
43,537
6
Johnston School Dept.
215
55
43,505
13
Pawtucket School Dept.
632
57
43,330
12


As far as individual retirees are concerned, however, the top list is much more dramatically dominated by judges:

Rhode Island’s 20 Highest Pensions
Former Employer
Age at Retirement
Gross Pension ($)
Years Retired
WEISBERGER, JOSEPH R State Police Judge (Supreme Court)
81
195,000
10
RODGERS, JOSEPH F State Police Judge (Supreme Court)
68
185,648
2
SHEA, DONALD F State Police Judge (Supreme Court)
70
174,144
16
ARRIGAN, ROBERT F State Police Judge (Worker’s Comp.)
70
171,567
8
MACKTAZ, PAMELA M State Police Judge (Family Court)
65
169,594
4
HIGGINS, Michael A State Police Judge (District Court)
66
168,770
1
DIPETRILLO, CARMINE R State Police Judge (Family Court) & Legislator
67
164,795
17
RAGOSTA, VINCENT A State Police Judge (Superior Court)
84
164,654
3
ROTONDI, JOHN J State Police Judge (Worker’s Comp.)
65
163,229
4
CRESTO, DOMINIC F State Police Judge (Superior Court)
67
162,800
12
GAGNON, RONALD R State Police Judge (Superior Court)
72
162,269
9
MOORE, PATRICIA D State Police Judge (District Court)
68
159,828
4
ISRAEL, RICHARD J State Police Judge (Superior Court)
71
159,762
10
LIPSEY, HOWARD I Superior Court
72
157,794
3
CAPPELLI, JOHN State Police Judge (District Court)
65
155,782
10
GRANDE, CORINNE P State Police Judge (Superior Court)
65
155,766
18
RAO, CARMINE A State Police Judge (Worker’s Comp.)
71
152,251
10
GORMAN, WALTER Superior Court
71
151,871
3
NAZARIAN, JOHN State
76
144,260
3
BERETTA, VICTOR State Police Judge (District Court)
65
143,003
18

Occupy Phil Donohue

If you are under the illusion that the ‘Occupy’ folks are onto something new… check out this terrific video blast from the past from the Phil Donohue show …

Milton Friedman on the socialist utopia: “Where in the world are you going to find these angels who are going to organize society for us?”

 … Burnside park with the philosophy advocated below? 

The Pension Illusion

The Illusion of Public Sector economics

There is something important to keep in mind as we start down the path of debating pension reform in Rhode Island. It is perhaps not the most vital point in a debate where what really matters is “Truth in Numbers”, as Treasurer Raimondo puts it, but as a premise by which we frame the debate it is certainly worth noting.

The premise is that employees contribute to their pension plans. It is, in a very important way, false.

The premise is not unlike the related illusion that businesses pay taxes. They don’t. Not just in the Warren Buffet pays less than his secretary way. (Which is of course, baloney – he probably pays more sales tax on a dinner tab than the average secretary pays in income taxes in a year.) But rather, in the sense that corporations just pass through their costs to their customers.

It’s a failure to understand macro-economic concepts relating to the allocation of capital in a capitalist system that leads to this illusion. That may sound a bit high-brow, but really it just requires a bit of thought about human nature.

Imagine that you are going to invest in a business – perhaps you have $1000 in a 401k and you have to decide what stock to buy. You need to decide how much risk you’re willing to take and then look around to see what business will give you the best interest rate on your $1000 investment. Maybe you call an investment advisor to help sort it out.

That advisors job is to sift through the tens of thousands of companies out in the world and decide how risky they are and what return they generate. Since they can’t look at every company every time they need to get some advice, the market has created some short-cuts. Stock exchanges are probably the first layer of filtering. New York Stock Exchange listed companies have to be big and stable. The “Dow Jones Industrials” are an even more exclusive list of the power players.

There are other short-cuts as well. Things like “price-earnings” or “P/E” ratios give us an estimate on how much interest an investment n a company will pay. And different industries have different standards for where those P/E rations should be. Strong companies can pay out less interest because they are less risky. Speculative investments require higher interest rates to justify the risk.

So what does this have to do with corporations and taxes? Simply put, if you raise a tax on a corporation it doesn’t lower their earnings. They need to maintain the value of their stock, and that requires maintaining earnings. So what they do, along with all the other companies in their industry, is raise prices. So who pays taxes on Amazon, or Wal-Mart, or Big Oil? You do.

And what does this all have to do with pension contributions? It’s a different problem, but the same illusion. When a company “contributes” to an employee pension – say 50% comes from the employee’s paycheck and 50% from the “company” – it’s really just coming out of the employee’s pocket. If it weren’t for a variety of complicated and costly governmental carrots and sticks found in the tax code, the company would probable just as happy to give that cash directly to the employee. On their books “salary” and “benefits” are just two sides of the same coin. It’s what it takes to convince someone to spend eight hours a day on the shop floor or at a desk pushing paper.

In the end, the cost is the cost, and whether they pay it in the form of salary or benefits doesn’t really do much to impact their competitiveness. It may be convenient to have your employer pay for your dental insurance, or your retirement fund, or a disability plan, but if they told you they were just going to give you all that money directly – say a 30% raise – and you could buy it yourself, would that be a reason to turn down the job? Probably not.

With public sector workers the same illusion applies. They don’t “contribute” to their pension, even if their pay stub shows two percent or 10 percent or whatever the split might be. That’s just a slice of the cost of employing that person.

The problem we have with public employee pensions is not how we allocate the split – whether it shows up as 90/10 or 10/90 on a government workers pay-stub, 100% of the cost is coming straight out of your pocket in the form of taxes.

So – that was all by way of a preface.  Why I care about these type of illusions is because getting this basic economic perspective helps us understand the roots of the pension crisis.  The crisis stems from lack of (1) market controls and (2) limitations on worker rights that prevent us from knowing how much that employee is costing us and where the purported “contributions” are going.

The market controls are those described above – in the private sector businesses need to maintain profitability or no one will invest in them. They can’t risk making promises without properly funding them because of market transparency. If investors discovered a multi-billon dollar unfunded liability in a company with only a few billion in revenues coming in each year, that stock would plummet. Since that scares the heck ot of investors they require all sorts of private controls lke independant actuaries and outside auditors.

With a government, there is no such control. Ratings agencies provide same level of oversight, and the voters technically have a say in firing the leaders who caused the mess, but in reality there are not adequate incentives for the people to provide their own oversight. In Rhode Island, as elsewhere, actuaries are ignored or written off as doomsayers.  Worst of all, government finances are an impenetrable black box to most citizens.

The pension fund itself is another black box, and in effect it’s as if workers are not allowed to see what has been put aside for their retirement. There are promises of future payments of course, but since the money needed to keep those promises is not there when a pension system is not properly funded the retirees can only hope that the checks will show up each week.

Essentially the state has taken the pension money and frittered it away by not funding the pension system. If a private investment firm did what the state did somebody would be led away in handcuffs. In the private sector a retiree has the right to sue a trustee that was supposed to be managing their money in good faith. It’s an interesting legal question as to whether a state pensioner could sue state officials for breach of their fiduciary duty. The retirement board’s own actuaries have stated publically that the projected returns are more likely than not unachievable – they tell us that we have a 42.5% chance of seeing a 7.5% average rate of return, but they’re still basing our reform plans on that bad assumption. A 42.5% chance of getting the promised pension check? Is that a risk retirees should be happy with? My suspicion is that they expect odds somewhere above 90%, and if so they are not wrong to hold such expectations (And wold they be wrong to demand such certainty?)

Shouldn’t the retirement board be held responsible for placing workers pension checks at risk? If not, then what’s the point of calling them trustees?

In the end, we are the victims of these illusions. The pensioners of the state of Rhode Island and it cities and towns have been mis-led to by politicians and union bosses who knew what was going on. They had a view inside the black box, and told the workers who were relying on their professional oversight that everything was fine – that their contributions were earning interest and were adequate to fund a stable retirement.

Really it was a lie on top of a lie. The contributions were not made and the black box was just another insider’s piggy-bank.

***


Pensions Beyond Pay

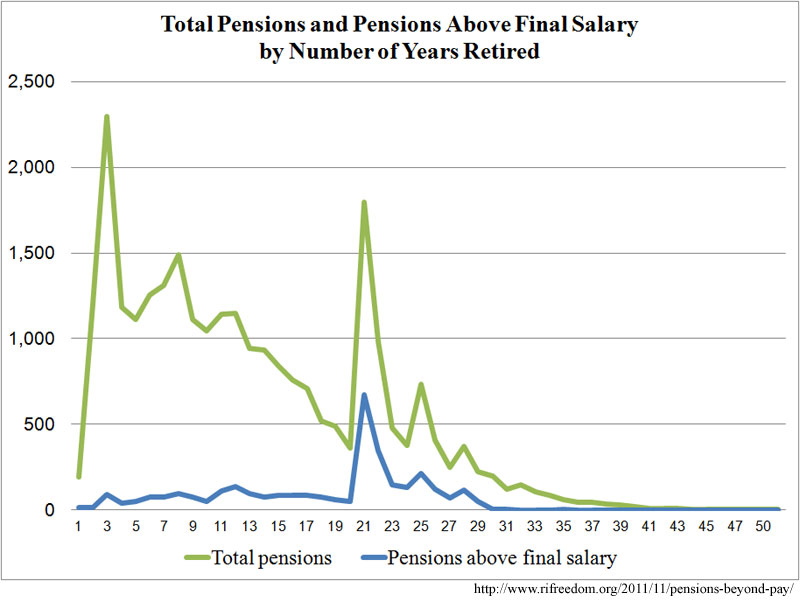
Among the more detailed features of the RIOpenGov.org pension page is the comparison of pensions against final average salaries. A push of the button on the “detailed search” tab shows there to be 3,298 pensioners whose retirements are paying better than their jobs ever did.

These retirees are collecting $20,903,314 more from the state than they did in the final years of their careers. On average, they have been retired for 18 years and still have an estimated 13 years to go — having retired at 56. For all retirees, the corresponding averages are 13 years retired, with 15 to go, having retired at 58.

Interestingly, the number of pensions above pay does not match up with the number of years retired as well as one would expect. Apart from a huge burst of retirements in the early ’90s, the trend line for total retirements isn’t surprising; the farther from retirement pensioners get, the fewer of them there are:


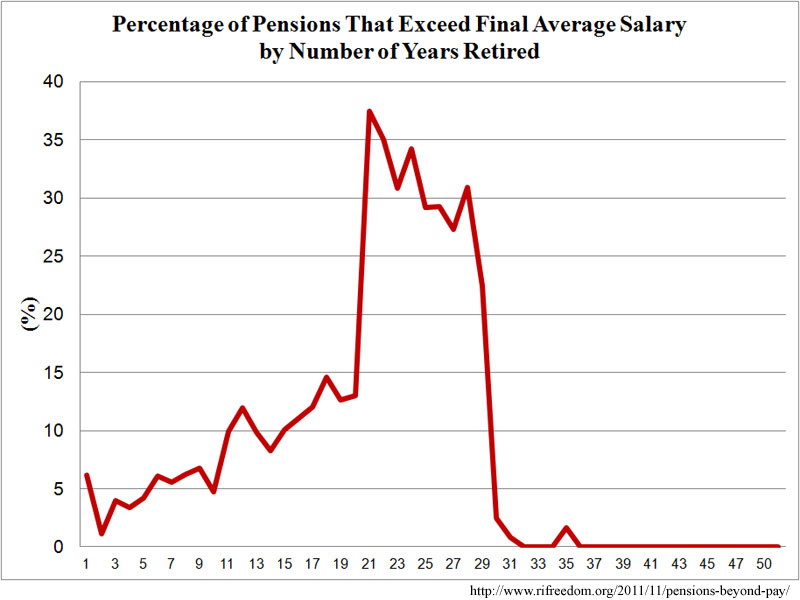
Viewing pensions that exceed pay as a percentage of total pensions, however, yields a more unexpected result:


As a matter of simple arithmetic, it would make more sense for the percentage to continue to grow as the years go up, thanks to cost of living adjustments (COLAs).  That the result does not match expectations merits further investigation, but for the time being, suffice it to say that such peculiarities give some credence to suggestions that pension deals of the past were inordinately generous and should be pulled back.

Among retired public-sector workers whose pensions exceed their working salaries, the average pension is $45,815 per year, which is $6,338 more than the average final salary. For the pension system overall, the average is $31,388, which is $12,021 less than the average final salary.

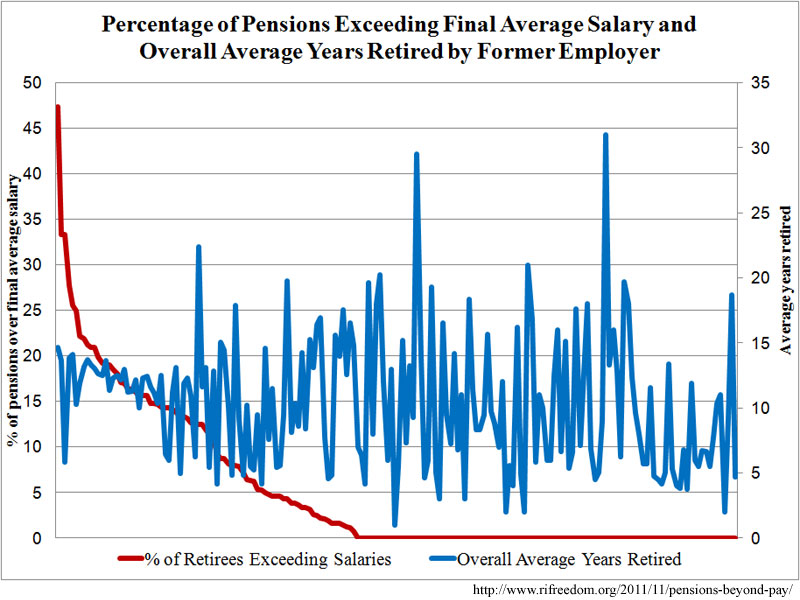
At this point, it makes sense to look at differences in the results based on the retirees’ former employers, and clearly, not all pension-granting public entities are equal. Of the 184 public employers, 81 have retirees who have surpassed their salaries. For 43 of the employers, more than 10% of all retirees are in this group.

% of Retirees Exceeding Salaries
Overall # of Pensions
Overall Average Pension ($)
Foster School Dist.
47
19
40,962
Burrillville Police Dept.
33
9
28,660
Northern Rhode Island Collaborative (NC)
33
6
16,222
Barrington Public Schools
28
202
42,651
Warwick School Dept.
26
980
44,598
North Providence Hsg. Auth.
25
4
22,592
Cumberland School Dept.
22
334
43,614
Middletown Public Schools
22
242
42,334
Newport School Dept.
21
363
41,593
Johnston School Dept.
21
215
43,505
Coventry Public Schools
21
325
47,098
Cranston School Dept.
20
769
44,425
Lincoln School Dept.
19
193
45,148
Providence School Dept.
19
1361
41,604
North Smithfield School Dept.
19
116
41,529
Pawtucket School Dept.
19
632
43,330
Tiverton School Dept.
18
161
41,322
East Providence Schools
17
479
45,030
Scituate School Dept.
17
100
41,365
West Warwick School Dept.
16
275
45,431
Foster/Glocester Reg. School Dist.
16
104
39,093
Woonsocket School Dept.
16
469
42,289
Central Falls Collaborative
16
166
44,896
Portsmouth School Dept.
16
211
43,065
North Kingstown School Dept.
16
307
41,183
Little Compton School Dept.
15
27
38,233
North Providence School Dept.
15
251
46,787
Glocester School Dist.
15
41
38,173
South Kingstown School Dept.
14
230
40,237
Coventry Fire Dist.
14
7
33,822
Town of North Smithfield
14
14
15,970
Chariho Regional School Dist.
14
248
40,728
Bristol Warren Reg. School Dist.
14
296
41,421
EAST GREENWICH-COLA-NC
13
15
17,591
North Smithfield Police Dept.
13
15
26,427
East Greenwich School Dept.
13
175
41,045
Burrillville School Dept.
13
158
42,284
Cranston Police
13
8
41,956
Westerly School Dept. (NC)
13
8
13,585
Westerly School Dept.
12
217
43,149
State
12
10,945
27,139
City of Pawtucket
11
105
20,739
Smithfield School Dept.
11
173
41,023
City of Woonsocket
9
65
22,746
Newport School Dept. (NC)
9
171
16,049
Jamestown School Dept. (NC)
9
23
12,951
Narragansett School Dept.
8
123
40,643
Town of South Kingstown
8
25
25,559
Warren Police Dept.
8
25
24,693
Narragansett Bay Commission
8
38
19,563
EAST GREENWICH-COLA
7
14
29,504
Jamestown School Dept.
6
31
41,140
City of Cranston
6
79
17,879
Town of Scituate
6
16
14,945
Exeter/West Greenwich Reg. Schools
5
75
39,039
Town of Johnston
5
38
19,537
East Providence Schools (NC)
5
304
15,041
Central Falls School Dist. (NC)
5
42
11,350
East Greenwich Police Dept.
5
22
32,698
Middletown Public Schools (NC)
5
22
18,716
R.I. Airport Corporation
5
22
43,537
Glocester School Dist. (NC)
4
23
9,698
Town of Warren
4
46
10,211
Newport Housing Auth.
4
26
21,796
Bristol Warren Reg. School Dist. (NC)
4
79
12,882
North Providence Fire Dept.
4
55
29,392
Johnston School Dept. (NC)
3
149
11,802
North Kingstown Police Dept.
3
30
33,592
Cranston School Dept. (NC)
3
418
12,929
South Kingstown School Dept. (NC)
3
117
12,226
Scituate School Dept. (NC)
2
41
10,525
Tiverton School Dept. (NC)
2
45
8,570
Chariho Regional School Dist. (NC)
2
47
14,184
Woonsocket Police Dept.
2
52
32,490
City of East Providence
2
62
27,958
Pawtucket School Dept. (NC)
2
377
10,952
Cumberland School Dept. (NC)
2
127
8,359
Town of Bristol
1
70
12,936
North Kingstown School Dept. (NC)
1
160
10,849
Woonsocket School Dept. (NC)
1
257
9,536
Town of North Providence
1
132
8,424

Notes:
“NC” indicates school personnel who receive municipal, rather than teacher, pensions.
“Overall” data is for all pensions, whether or not they exceed final average salary.


With some notable exceptions, schools in general and teaching staffs in particular dominate the list for retirees who make more in retirement than while working. And teacher pensions tend toward the higher end of the dollar scale.  However, there is no apparent correlation between the percentage of retirees over-earning their working salaries and the average number of years that each entity’s pensioners have been retired:


Removing Pension Dollars from the RI Economy

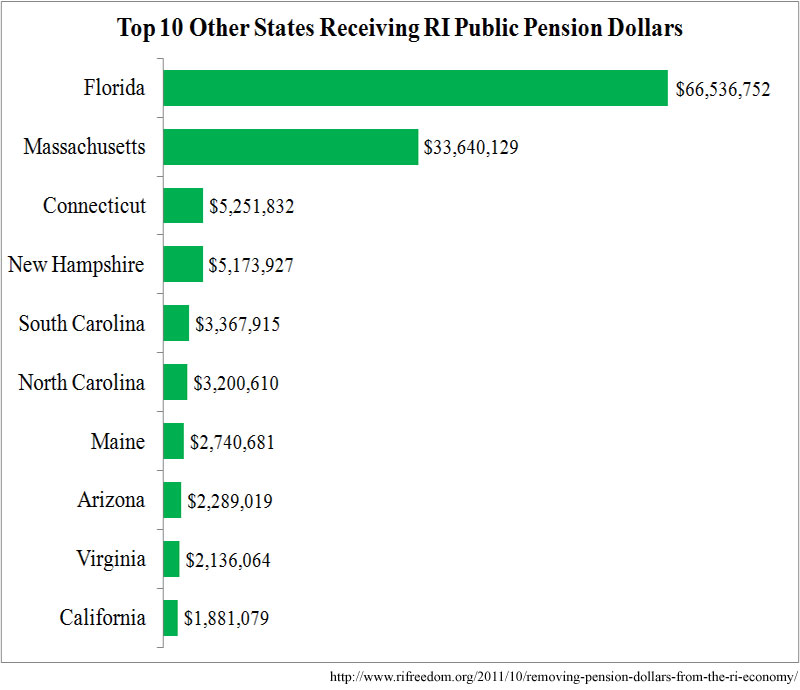
Rhode Island’s pension system sent $142,159,475 directly out of state, in 2010, to the 4,575 public-sector retirees who live elsewhere. That’s according to the RI Center for Freedom & Prosperity’s new RIOpenGov.org section on pensions. Overall, government pension payouts amount to approximately 1.7% of Rhode Island’s gross state product (GSP), and 17.2% of them support the economies of other states, with the following top 10:


The pension dollars lost to Rhode Island’s economy are of particular concern during this era of high unemployment and sluggish economic activity, when it seems as if political actors feel they must couch every argument about public policy in terms of economic stimulus. In the debate over pension reform in Rhode Island, National Education Association Government Relations Director Pat Crowley got ahead of the pack by telling GoLocalProv on October 21 that freezing cost of living adjustments (COLAs) would “be a major drain on the Rhode Island economy.” The following week, the Brown Daily Herald noted the point being made in the wave of Finance Committee testimony. The assertion, in brief, is that if retirees’ pensions do not match or exceed inflation, they will have less cash to spend, which means that less money will cycle through the local economy.

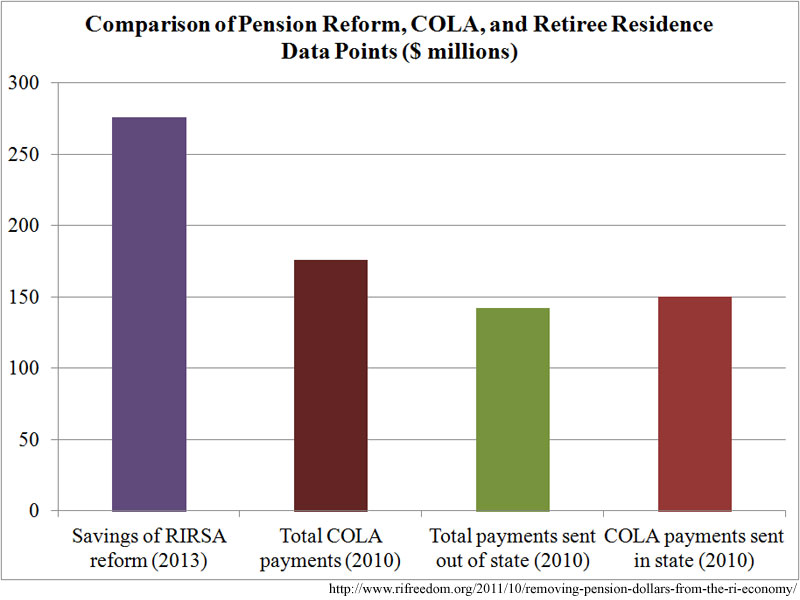
The broadest response to such claims is that every dollar paid into the public sector pension system has to come out of the economy in the first place, most of it reducing local buying power in order to fund national and international investments. In that light, General Treasurer Gina Raimondo’s proposed reform — any reform — would count as stimulus. The state’s pension actuaries, Gabriel Roeder Smith & Company, estimate that the retirement system will require state and local governments to contribute $659 million in fiscal year 2013 without reforms, but only $383 million with the proposed reforms. That’s a difference of $276 million that taxpayers could use to pay bills, purchase goods and services, and make investments.

Meanwhile, additional data from RIOpenGov.org shows that the pensions paid out in 2010 were augmented by $176.0 million for total COLAs already applied to base pensions. In other words, while special interests are arguing that freezing COLAs at their current level would harm Rhode Island’s economy, the state could erase COLAs from the pension system entirely and the economic harm still wouldn’t amount to two-thirds of the economic benefit that the current (arguably too restrained) reform would represent for local economic activity.  (All of this leaves aside, of course, the additional benefit of proving that the state is interested in securing its future.)

And as the total pension dollars sent out of state show, that’s not the whole picture. If COLAs are distributed equally among retirees in state and out of state, $149.6 million of the money paid to retirees who live in Rhode Island is attributable to the adjustments. That means that completely eliminating every penny of current COLA payments would have about the same economic impact, in Rhode Island, as paying for the retirements of people who don’t live here.

Whether these amounts are significant in a $47.6 billion state economy is a matter of opinion. So, too, is the legitimacy of various changes and restrictions that the state could consider imposing on pensions. When assessing the impact of reform, however, it is critical to consider the many ways in which Rhode Island’s public-sector pension system interacts with the economy.

Later Retirement Doesn’t Harm School Districts’ Payroll Costs

National Education Association of Rhode Island President Larry Purtill is gaining some traction with his claim that having teachers retire later will hit local communities in the payroll. As described in an October 25 Providence Journal story by Kathrine Gregg (not online):

Sen. Walter Felag, D-Warren, asked the question that Larry Purtill, president of the National Education Association of Rhode Island, has asked on YouTube and elsewhere: how will city and town taxpayers be able to afford all of the top-scale teachers who would now be forced to work until they are 67 years old?

A top-step teacher averages $70,764 a year in Rhode Island; a first-year teacher averages $39,087, according to Purtill.

Purtill has not yet had his turn to testify before the legislators, but in other venues he argues: “If a teacher is forced to go from 62 to 67 to retire and would have been replaced by someone on Step 1, that is an additional $130,479 for one teacher over that five-year period. Has anyone thought about this, and figured it into the actuarial studies? I am assuming that unless state aid increases by a drastic amount, this cost will go directly to the cities and towns.”

There’s a reason Purtill stops his cost clock at five years: because after that point, the older teacher retires and a replacement is hired at step one. Obviously, that teacher will be making less, to start with, than a teacher hired five years earlier, so the scenario of a later retirement actually begins to save the district money. And the district continues to save money for the ten years it takes the new teacher to reach step ten, herself.

To put a number on this dynamic, I averaged all of the salary steps compiled by the Rhode Island Association of School Committees for the 2011/2012 school year. For easier comparison, I then removed the few districts that spread their steps over more than ten years, leaving me with 14 cities and towns. (To check for any distortion, I compared these districts to the broader average available for 2010/2011 and found them to be about 0.1% higher, overall.) Using these averages, I figured out the year-to-year step raises and factored in the 4% increase that the pension actuaries estimate that the overall step system receives each year, on average (inflation plus general increase). By this method, I found step one to be $39,175 and step ten to be $72,393.

It is true that a local district will therefore pay an extra $141,475 for five more years of the older teacher’s salary, compared with a replacement starting at step one. However, seven years after the delayed retirement, the savings in waiting to hire her replacement have erased the extra costs. By the time the later replacement reaches step ten, the district turns out to have saved $44,990, and that number holds for decades, until the year that the earlier replacement would have retired.

Remember that this is savings to the district on salary alone. Most districts offer retirees some sort of health benefit, which will erode the initial salary savings of earlier retirement. What’s more, a good number of districts only pay retiree healthcare until Medicare age, so pushing retirement beyond that point would eliminate the healthcare portion of districts’ other post-employment benefits (OPEB) liability completely.

An important note arises if we expand the inquiry to figure out the cost/savings of later retirement in terms of the older teacher’s pension. Such an analysis is difficult to perform, because changes to the retirement system over time have left a number of categories into which employees can fall; moreover, teachers can retire at various ages, with varying years of service, so an accurate comparison would require teacher-by-teacher analysis.

For illustration purposes, however, I assumed normal retirement at age 62 with 29 years of service on a non-grandfathered Schedule A. (That means the teacher receives the more generous percentage of pay that Schedule A provides but has the retirement benefit calculated as an average of his or her highest five years, not three years, as would be the case for a grandfathered Schedule A pension.) For the second scenario, I added five years to this teacher’s career, but followed the proposed pension reform such that the teacher only accrues an additional 1% of salary for each additional year of work. I did factor in cost of living increases for both scenarios, but I used the reformed rate, which ties increases to pension fund performance.

The upshot is that the later retirement saves the retirement system about $54,000 over the life of an individual teacher. But those savings only materialize under the terms of the proposed reform. Applying a later retirement to the current system, without other reforms, winds up costing money in the scenario I’ve described, because the starting pension rate and higher cost of living adjustments (COLAs) increase the total benefit by so much.

Whatever the case, under the current system, the teacher is working for 29 years and retiring for 25. Under the reform, he or she is working for 34 and retiring for 20. Put differently, under the current system (with all of my assumptions), the older teacher will be collecting retirement for almost the entire career of his or her replacement. Essentially, for just four years will the system be paying for only one teacher for one teaching job. Under the reform plan, that differential increases almost fourfold, leaving fifteen years of the replacement’s career unburdened by pension costs for the older teacher.

One needn’t run the numbers to get a sense of just how quickly Rhode Island and its cities and towns — collectively and individually — will save money.

Task Force Commentary: R.I.’s pension debt worse than admitted (by Jagadeesh Gokhale)

As part of the national task force that our Center has assembled, Jagadeesh Gokhale, from the Cato Institute, published the OpEd below that appeared in the Providence Sunday Journal, Oct. 23, 2011.

R.I.’s pension debt worse than admitted

JAGADEESH GOKHALE

WASHINGTON, DC -Rhode Island’s pension crisis reminds one of Greece, now slaving under externally imposed austerity — the fruits of engaging in systemic deceit.

Lavish retirement benefits, including automatic inflation adjustments, awarded to state employees have resulted in future pension obligations of $11.5 billion in today’s (2010) dollars. But the state has assets worth only $6.8 billion on hand to cover these obligations, implying a funding ratio of less than 60 percent.

In addition, the state provides other post-employment benefits (OPEB) to its employees (general employees, teachers, police, judges, legislators, and so on) — whose present valued obligation amounts to $8 billion. This obligation is completely unfunded — that is, benefits are paid out of current revenues each year.

Adding it all up, the official measure of total pension and OPEB liabilities as of 2010 is $12.3 billion and the unfunded component is $5.5 billion.

Taking the numbers at face value, the state must make up this $5.5 billion shortfall in retiree pension and OPEB programs by increasing the share of general fund budget devoted to covering accruing pension obligations and amortization costs.

State general fund revenues amounted to $5.5 billion in 2010, of which 4.2 percent is contributed to meeting current benefit accruals and amortization costs. The state’s pension obligation amortization schedule extends to about 20 years, but OPEB obligations will remain unfunded.

Unfortunately, the reality that is most likely to unfold in the future is much worse. The accounting methods used by the actuaries amount to sugarcoating the situation. The true magnitude of the Rhode Island’s pension and retiree health underfunding problem is larger by billions of dollars.

As economists have repeatedly asserted, because pension benefits are guaranteed, they should be evaluated by discounting future benefit flows using a relatively safe rate of return — on the order of 3 percent per year in inflation-adjusted terms. Pension actuaries, instead, use the much higher rate of return they expect on the pension fund’s assets — which are usually invested in risky private equities and bonds.

This accounting treatment undervalues (ignores) the risk that the relatively fixed and certain benefit obligations would have to be paid out of additional taxpayer funds because the pension fund’s asset portfolio suffers losses from a market downturn precisely when it must be drawn upon (sold) to fund benefit obligations coming due.

Discounting future benefit flows at a risk-adjusted rate of interest, however, is politically unpalatable because it results in a much higher measure of pension liabilities and increases the current funding burden on the state’s budget.

In the case of Rhode Island, the state’s Comprehensive Annual Financial Report for 2010 (the most recent available) specifies an expected return on pension assets of 8.25 percent. The present valued pension and retiree health liability reported earlier are calculated using that discount rate.

However, using a risk-adjusted rate of return in evaluating the pension liability, and incorporating a 2 percent annual growth rate of the retiree population, shows that the total accrued pension and health liability would be 56 percent larger — or $18.7 billion instead of the official total of $12.3 billion. And the unfunded liability component would be $11.9 billion instead of the officially reported $5.5 billion.

There are other concerns, as well, regarding the level of contributions being made by Rhode Island to amortize this liability and the management of the pension fund’s investment portfolio. Ongoing reform efforts are likely to affect current and future state employees, but the understatement of pension liabilities hides the size of taxpayer exposure to future pension funding shortfalls.

A thorough exploration of feasible pension reform alternatives in Rhode Island is urgently needed. Unfortunately, the underlying data on historical earnings, job tenure and other information on state pension plan participants has been kept under wraps by the authorities.

This impedes transparency and the ability of state lawmakers to analyze and draw upon new ideas on how to resolve the state’s pension funding dilemma and improve the programs’ financial condition over time. That has to change soon if there is to be any hope of dealing with this crisis.

Jagadeesh Gokhale is a senior fellow at the Cato Institute in Washington D.C.

Hybrid Savings Mean System Failure

The only argument that I’ve heard against my suggestion that the proposed hybrid pension system will be more expensive than the current system is that the hybrid offloads market risk onto the employee, alleviating the risk to the employer (i.e., us, the taxpayers). Moderate Party founder and gubernatorial candidate Ken Block made the point on Anchor Rising, and Gary Morse, pension adviser to the Republican who was almost governor, John Robitaille, called in when I was on Friday’s Dan Yorke Show to make a similar point.

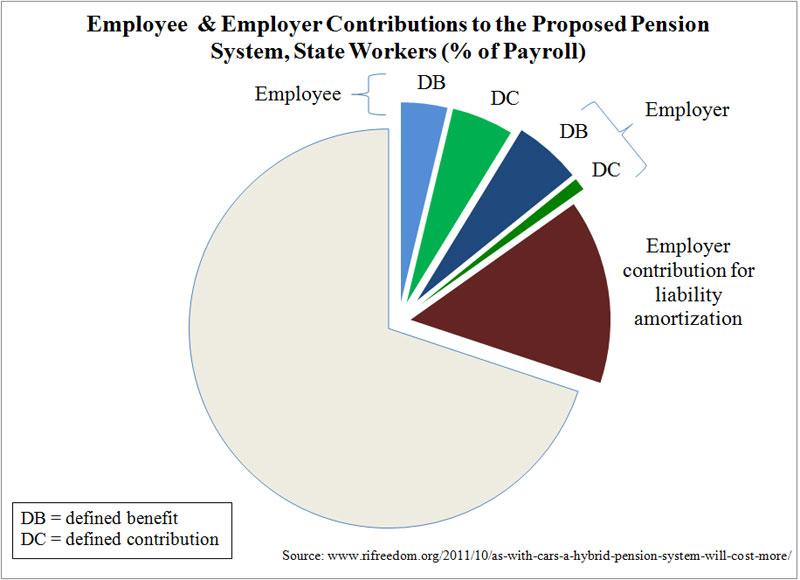
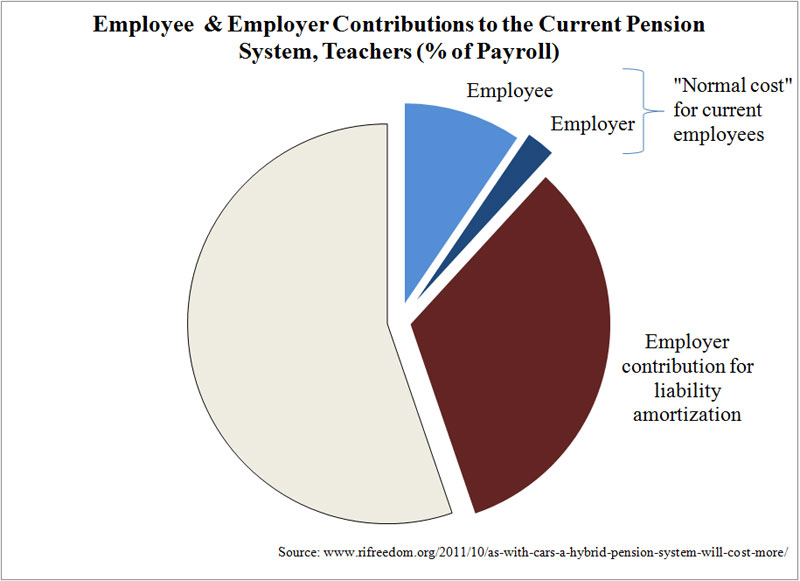
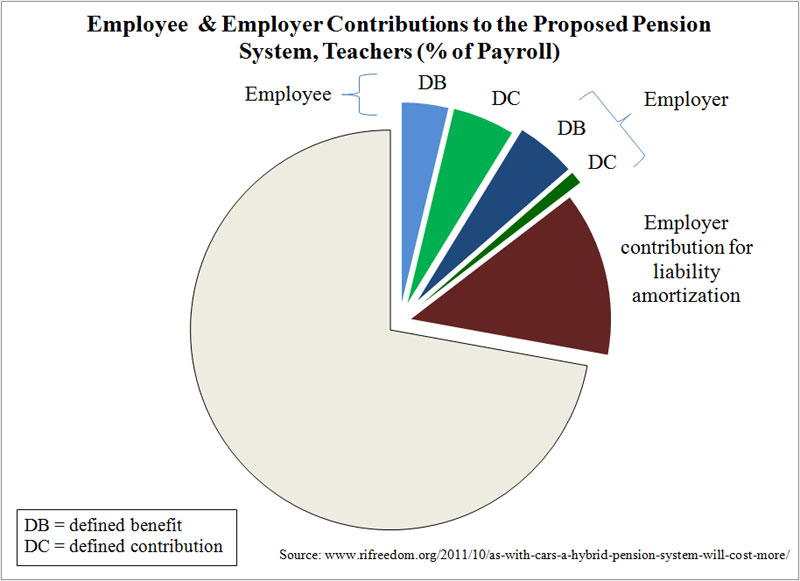
My response has been to suggest that, while the objection may be true, the entire pension reform relies on the 7.5% rate of return that the state’s actuaries have assumed. As a reminder, the current system is a defined benefit plan, which promises employees a certain retirement package; the hybrid system would decrease that benefit but put money into a 401(k)-style plan for each employee to fill in the gap. Right now, the major problem is the liability for defined benefit promises already made, and the hybrid doesn’t make those go away.

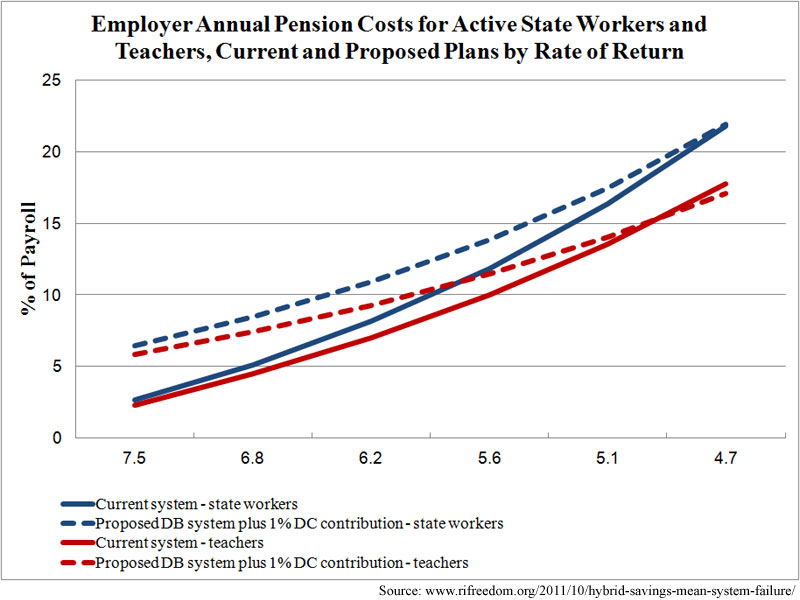
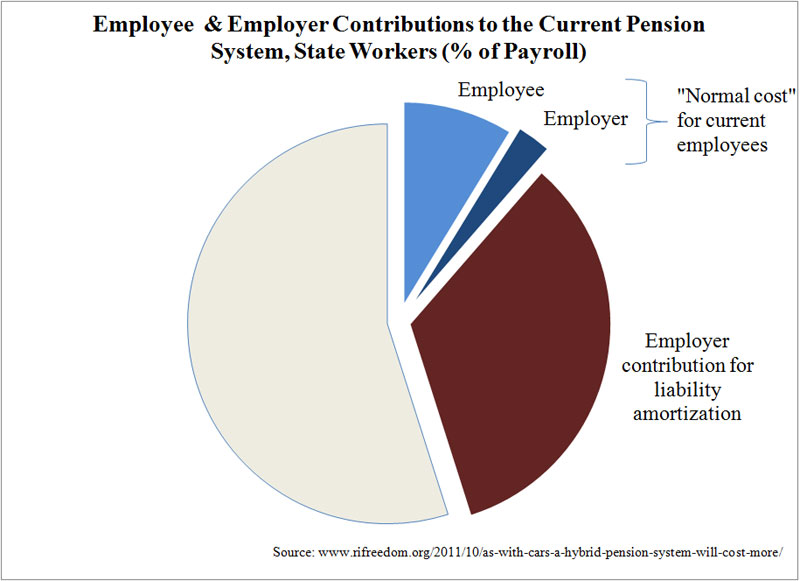
Unfortunately, I haven’t come across “what if” data from the actuaries that allows a real comparison of the system’s health with different rates of investment return. One can, however, infer the effect of the Retirement Board’s recent lowering of the return rate assumption from 8.25% to 7.5% from the latest actuarial report. Specifically, the Board dropped the rate of return by 9%, and the normal cost of an active employee’s pension (that is, the percentage of payroll that must be put aside to fund an individual employee’s retirement) went up by 22% for state workers and 18% for teachers.

For an accurate “what if” scenario, the actuaries would have to apply the different assumptions to their models, but purely for the sake of illustrating my point about the cost of the hybrid plan, I’ve assumed that same return-rate-to-normal-cost ratio applies consistently to the equation. If that’s accurate, then the hybrid plan doesn’t cost the taxpayer less than the current system unless the market returns less than 5% on investment:

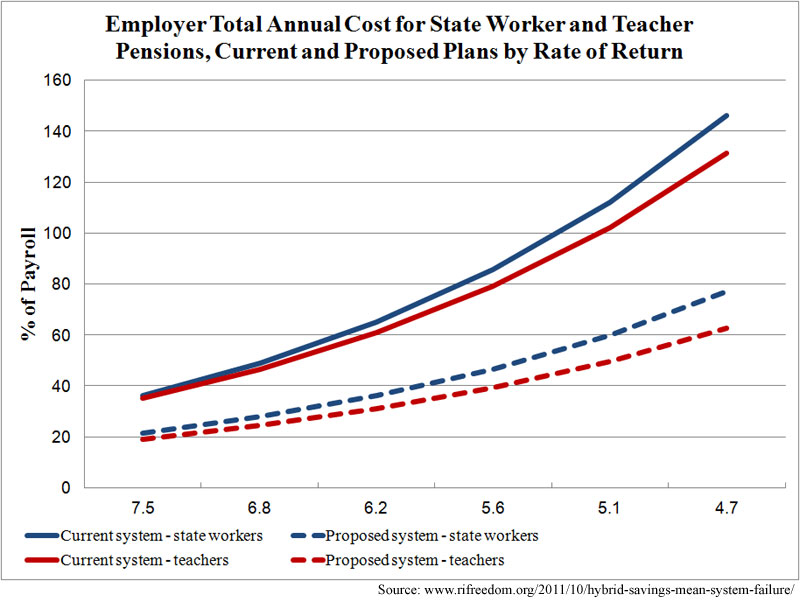
The solid lines show the effects of an under-performing market on the current defined-benefit plan; the dotted lines show its effects on the hybrid plan. And, yes, the lines do cross eventually. However, under those circumstances, the total cost for the pension system to the employer, even under the reform, will be well above the annual cost that currently has everybody in a panic — over 60% of payroll for teachers and nearing 80% of payroll for state workers:

Of course, the solid lines, which track the current system, show just how scary the situation will be if the General Assembly does nothing, and a defined contribution component ought to be part of the solution (if not all of it). That doesn’t mean, though, that reformers should take the system on the table just because it incorporates some worthwhile concepts. If this reform passes, it’ll be years before the panic level rises sufficiently for further action by elected officials, and by that point hundreds of millions of dollars will have been siphoned into untouchable defined-contribution accounts.