RIVotes.org

RIVotes.com now live! Transparency to hold your Legislator Accountable

Go to RIVotes.com

October 2, 2012: The non-partisan Rhode Island Center for Freedom and Prosperity announced today the launch of RIVotes.com, an online transparency tool that allows the public easy access to the voting records of state legislators as well as the capacity to search for and track pieces of legislation in the most comprehensive manner available during the legislative session.

RIVotes.com is designed to help community leaders, businesspersons, newspersons, public officials, and members of the general public understand how their legislators voted on bills that affect their communities, businesses, schools, or families. This transparency and accountability website allows citizens take a more active part in the democratic process.

The Center recently added 2012 bills into RIVotes.com, which also includes legislation as far back as 2009. RIVotes.com features a host of user-friendly functions, including:

  • View the voting record of any legislator by all bills, by category, or by date range.
  • Easily create a “Missed Votes” or a “Voted Against Majority of own Party” report.
  • Find bills of specific interested, with searches by topic, keyword, date range, or bill number.
  • Build your own custom “scorecard”: choose the bills to include and the “correct” vote; RIVotes.com automatically creates a legislator-by-legislator scorecard.
  • Interactive discussion forums and social media integration to allow you to join with other citizens in posting comments and initiating viral distribution.
  • Sign up for automatic email notification when action is taken on bills that interest you.

“Combined with our recently released General Assembly Freedom Index, our Center is providing unprecedented transparency to citizens about the voting histories of their state Senators and Representatives,” said Mike Stenhouse, CEO for the Center. “In order to protect our free and democratic society, citizens must remain well informed about what their government is doing and must hold their legislators accountable for how they vote,” added Stenhouse.

The RI Center for Freedom & Prosperity also plans to utilize a new feature of RIVotes.com to automatically send out regular voting summaries to local media entities and to interested taxpayer groups during the 2013 legislative session.

RIVotes.com is the second transparency website launched by the Center: RIOpenGov.org was launched in 2011 to provide detailed pension payment data for state and municipal employees. RIVotes.com is a copyrighted product of the Mackinac Center for Public Policy.

The Rhode Island Center for Freedom and Prosperity, a non-partisan public policy think tank, is the state’s leading free-enterprise advocacy organization. With a credo that freedom is indispensable to citizens’ well-being and prosperity, the Center’s mission is to stimulate a rigorous exchange of ideas with the goal of restoring competitiveness to Rhode Island through the advancement of market-based reform solutions.

WATCH: Mike Stenhouse discusses “What’s a Citizen to Do?” on State of the State TV

Center Hosts ATLAS SHRUGGED 2 Movie Premiere Event

Ayn Rand fans gather with the Center's staff

The RI Center for Freedom and Prosperity invites friends of the Center and all free-enterprise loving citizens to the world premiere movie showing at the Lincoln Cinema World on Friday, October 12, 2012 at approximately 7:00 pm.

For a small, tax-deductible donation to the Center, registrants receive a movie ticket and FREE Atlas Shrugged II bonus items including an XL T-Shirt, and a raffle ticket for a drawing for posters, mug, and cap. Upgrade packages also offered.

Support our Center!

Click here for the event home page and to REGISTER for the event!

Rhode Island Employment Snapshot, August 2012

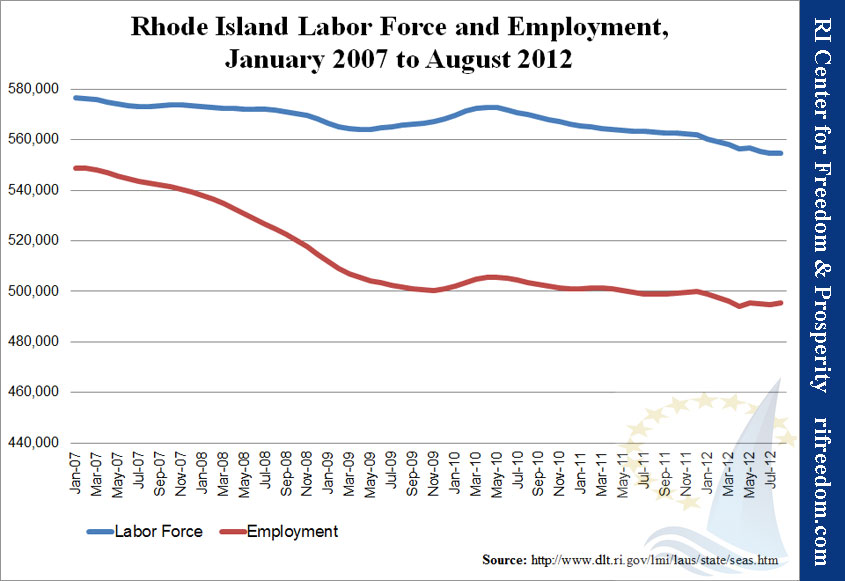
Rhode Island’s unemployment rate fell a tenth of a point in August, to 10.7%, still second only to Nevada.  This month, the results could be termed “mixed,” but it’s a mix of bad and stagnant.  Employment actually increased, after a summer of losses, but even more gave up looking for work.

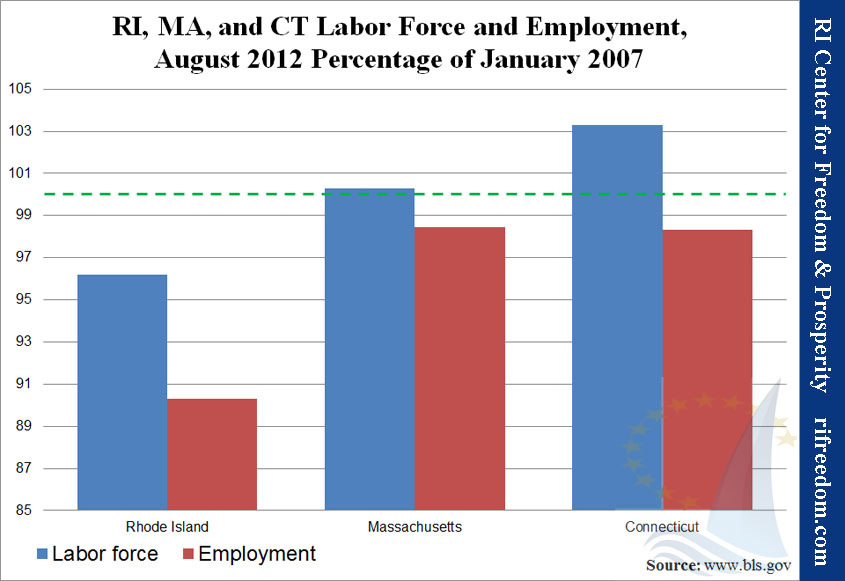
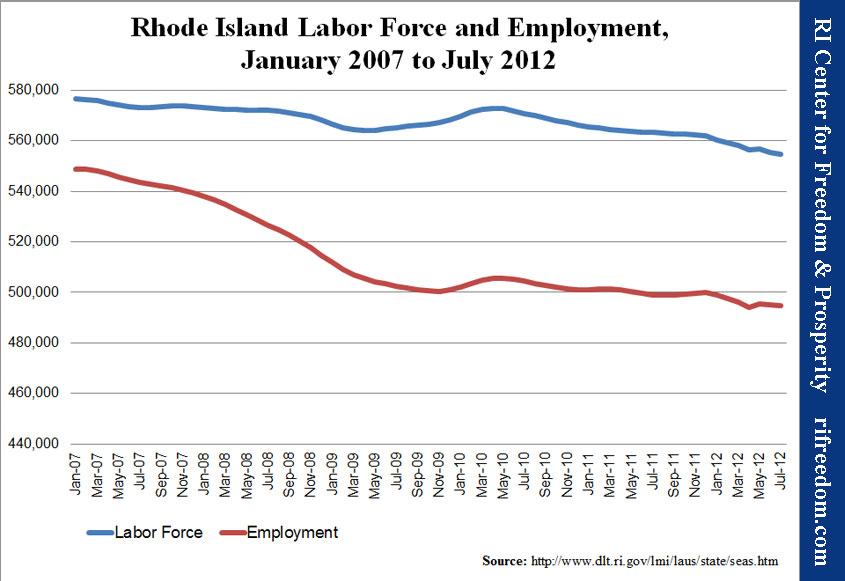
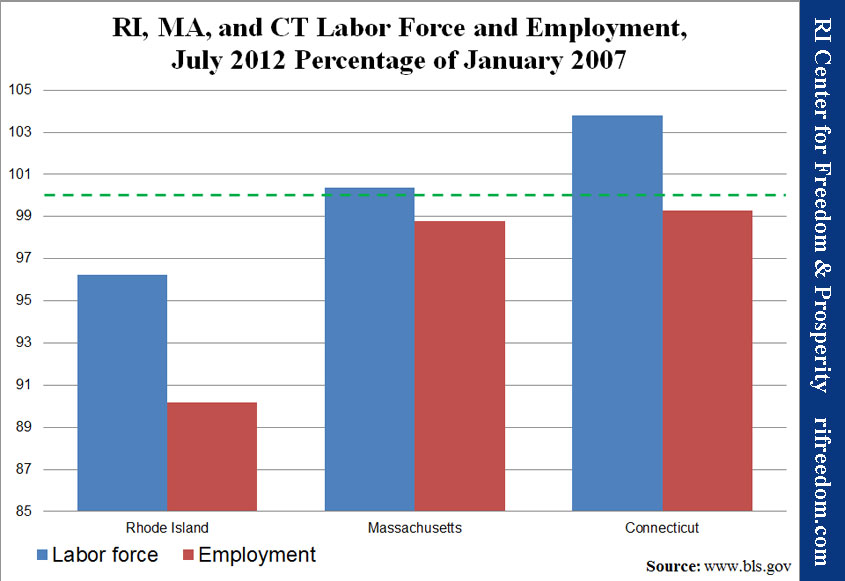
The first chart below shows the trends in labor force (employed and looking for work) and employment since the beginning of the recession in January 2007.  The second chart shows the labor force and employment pictures for Rhode Island, Massachusetts, and Connecticut as each state’s current percentage of January 2007.

Rhode Island Labor Force and Employment, January 2007 to August 2012


RI, MA, and CT Labor Force and Employment, August 2012 Percentage of January 2007

RI General Assembly Freedom Index

Download: Freedom Index 2012 Scorecard; legislator votes, bill explanations, and rankings ; Click here for the Media Release

Radio:  Stenhouse discusses Index on Dan Yorke radio show ; and on the Helen Glover show (@ the 13:00 minute mark)

The first-annual General Assembly Freedom Index by the RI Center for Freedom & Prosperity scores Ocean State lawmakers on their level of support for principles of freedom as proven by their votes on the floors of the House and Senate.

The index examines legislators’ votes in terms of their likely effect on the free market, the size and scope of government, the balance of residents’ interests against those of public employees and beneficiaries, and the constitutional structure of a divided government with limited power over the people whom it represents. The Center reviewed every bill that received a roll-call vote by the full membership of either chamber and selected 96 that fit its understanding of these criteria. (Companion bills only count once.)

The resulting scores give a detailed sense of each legislator’s priorities beyond a few high-profile issues.

The Center further divided the bills into five categories:

  • Tax & budget:  bills that affect the tax structure in Rhode Island and/or that relate to government expenditures, just driving or relieving the pressure on taxation
  • Regulatory environment: bills that make it more or less difficult to live and do business in the state by imposing regulations
  • Constitutional government: bills that affect the structure of the government, as well as the scope of government in its authority over residents’ lives
  • Public sector labor: bills related to the relationship between its employees and itself and the electorate
  • Education reform: bills that advance or impede the reform of the state’s public education system, in terms of both cost and quality

Most legislation has implications for more than one of these categories.  For the purposes of this index, we applied our subjective sense of the area of core effect and sorted the bills accordingly.  If, for example, a bill having to do with education seemed to us intended to secure the role of public employees, we classified that bill as Public Sector Labor, not Education Reform.

Download: Freedom Index 2012 Scorecardlegislator votes, bill explanations, and rankings

2012 Freedom Index Findings

Ninety-six (96) different pieces of legislation (counting companion bills once) were evaluated.  The Center judged 70 of them as having a negative effect on freedom.

The average legislator index score of -25.4 indicates that the General Assembly moved Rhode Island in the wrong direction, and that Rhode Islanders are less free than they were in 2011. This index underscores our Center’s view that the 2012 RI General Assembly did not positively address the dire business climate of our state.

Top and Bottom 10

House Senate
Top 10 Bottom 10 Top 10 Bottom 10
1 Costa 59.2 113 Bennett -46.0 1 Kettle 15.5 113 Tassoni -44.8
2 Gordon 58.7 112 Fox -45.3 2 Shibley 14.0 112 Lanzi -44.8
3 Newberry 42.0 111 Ajello -45.3 3 Moura 8.6 111 DaPonte -43.1
4 Chippendale 41.7 110 McNamara -45.3 4 Hodgson 5.2 110 Miller -42.0
5 Watson 33.5 109 Valencia -45.3 5 Maher 4.1 109 Lynch -42.0
6 Trillo 28.8 108 Blazejewski -45.3 6 Algiere -7.8 108 Perry -41.6
7 Morgan 15.3 107 Cimini -45.3 7 Pinga -12.1 107 Ruggerio -41.4
8 Ehrhardt 15.1 106 Silva -45.3 8 Bates -14.7 106 Goodwin -41.4
9 Reilly 13.2 105 Mattiello -44.6 9 Ottiano -17.0 105 McCaffrey -41.4
10 Palumbo 0.5 104 Ucci -44.6 10 Cote -17.7 104 Fogarty -41.4


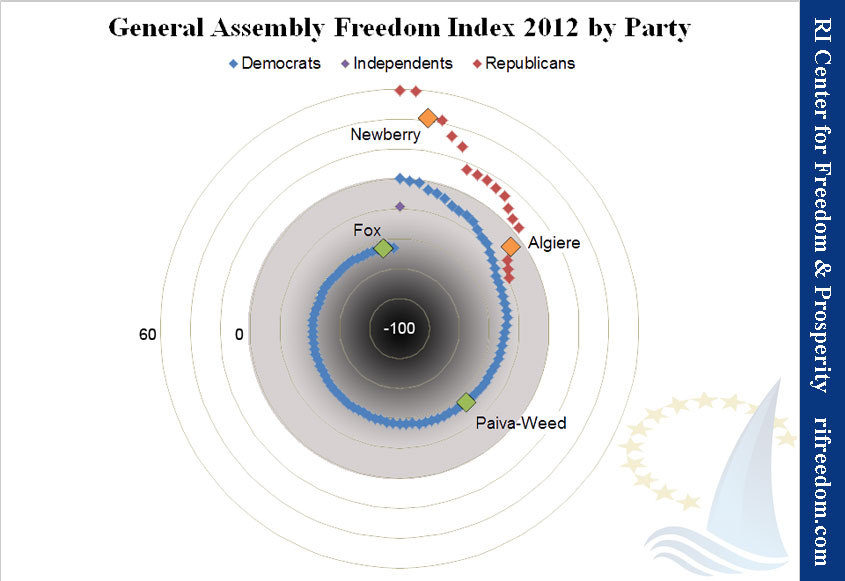
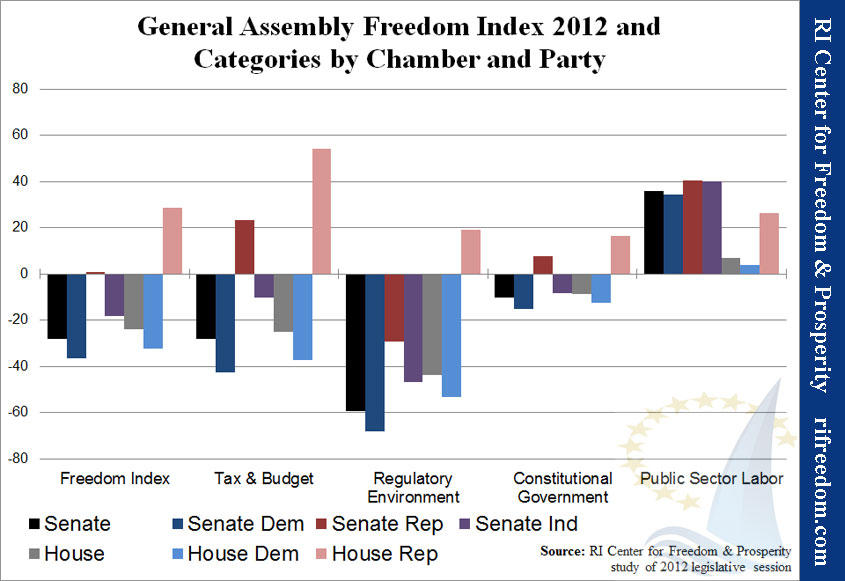
General Assembly Freedom Index 2012 by Party


Other findings include;

  • Average House index of -24.1
  • Average Senate index of -27.9
  • Average Democrat index of -33.5
  • Average Republican index of 16.5
  • Average Regulatory Environment index of -49.0
  • Average Tax & Budget index of -26.0
  • Average Constitutional Government index of -9.1
  • Average Public Sector Labor index of 16.7
  • No bills directly related to Education Reform were scored in this index


General Assembly Freedom Index 2012 and Category by Chamber and Party


Tax & Budget Category, Top and Bottom 10

House Senate
Top 10 Bottom 10 Top 10 Bottom 10
1 Newberry 68.8 75 Silva -67.2 1 Kettle 44.8 38 Pichardo -59.5
2 Chippendale 68.8 74 Bennett -62.5 2 Shibley 44.8 37 Lynch -54.3
3 Watson 68.0 73 Fox -62.5 3 Hodgson 44.8 36 Crowley -54.3
4 Trillo 67.2 72 Ajello -62.5 4 Moura 31.0 35 Tassoni -51.7
5 Costa 66.4 71 McNamara -62.5 5 Maher 24.1 34 Lanzi -51.7
6 Gordon 66.4 70 Valencia -62.5 6 Algiere 17.2 33 DaPonte -51.7
7 DaSilva 54.7 69 Blazejewski -62.5 7 Felag 10.3 32 Miller -51.7
8 Morgan 43.8 68 Cimini -62.5 8 Pinga 10.3 31 Perry -51.7
9 Reilly 43.8 67 Mattiello -62.5 9 Bates 10.3 30 Ruggerio -51.7
10 Lima 43.8 66 Ucci -62.5 10 Ottiano 10.3 29 Goodwin -51.7


Regulatory Environment Category, Top and Bottom 10

House Senate
Top 10 Bottom 10 Top 10 Bottom 10
1 Gordon 66.9 75 Mattiello -66.9 1 Hodgson -18.0 38 Miller -76.3
2 Costa 55.2 74 Tarro -66.9 2 Kettle -23.1 37 Tassoni -74.4
3 Watson 52.2 73 Naughton -66.9 3 Shibley  -23.1 36 Lanzi -74.4
4 Chippendale 27.2 72 Corvese -66.9 4 Moura   -23.1 35 Lynch -74.4
5 Newberry 23.5 71 Bennett -64.7 5 Maher -31.4 34 Perry -74.4
6 Trillo 17.6 70 Fox -64.7 6 Bates -33.3 33 Ruggerio -74.4
7 Ehrhardt  15.4 69 Ajello -64.7 7 Algiere  -35.9 32 Goodwin -74.4
8 Reilly 0.0 68 McNamara -64.7 8 Pinga -41.7 31 McCaffrey -74.4
9 Morgan -7.4 67 Valencia -64.7 9 Lombardo -43.0 30 Fogarty -74.4
10 MacBeth   -7.4 66 Blazejewski -64.7 10 Cote -43.6 29 Sosnowski -74.4


Constitutional Government Category, Top and Bottom 10

House Senate
Top 10 Bottom 10 Top 10 Bottom 10
1 Costa 61.2 75 Hearn -31.0 1 Kettle 29.7 38 DaPonte -29.1
2 Gordon 38.8 74 Jacquard -25.0 2 Shibley 24.3 37 Perry -19.6
3 Chippendale 36.2 73 MacBeth -22.4 3 Moura 18.9 36 Tassoni -18.9
4 Newberry 32.8 72 Bennett -19.8 4 Maher 18.9 35 Lanzi -18.9
5 Morgan 12.9 71 Hull -19.0 5 Pinga 6.1 34 Miller -18.9
6 Palumbo 6.0 70 Fox -17.2 6 Cote 6.1 33 Lynch -18.9
7 Flaherty 6.0 69 Ajello -17.2 7 Sheehan -2.0 32 Ruggerio -18.9
8 DeSimone 5.2 68 McNamara -17.2 8 Ottiano -4.1 31 Goodwin -18.9
9 Trillo 4.3 67 Valencia -17.2 9 Hodgson -8.1 30 McCaffrey -18.9
10 Schadone 3.5 66 Blazejewski -17.2 10 Algiere -8.1 29 Fogarty -18.9
(Note: Insufficient votes were cast in the Education Reform and Public Sector Labor categories for meaningful comparisons.)

Index Overview

The Center selected legislative bills for inclusion in the Freedom Index if they were deemed to have an effect on free-market, small-government, or constitutional principles, with each bill assigned a positive or negative weighting based on the criteria listed below. Weighted points for each bill were given to each legislator based on his or her roll-call vote on it.

Each legislator’s final Freedom Index was calculated as his or her score’s percentage of the total possible points. A positive score indicates a 2012 voting record that generally protected individual and economic freedoms, while a negative score reflects the opposite.

Disclaimer: It should be noted that the total Freedom Index score generated for each legislator is a direct reflection of the perspective of the RI Center for Freedom & Prosperity when it comes to the weighting of each bill. The Freedom Index is not an absolute measure of a legislator’s merit and does not constitute any endorsement or individual criticism. The Freedom Index is a tool designed for general research and for accountability, giving voters some quantitative metrics for their own assessments as to their elected legislators’ performance. 

Methodology

1) Determine weighting: Each selected bill received a weight ranging from +3 to -3, as determined by the RI Center for Freedom & Prosperity. Negative weights indicate legislation that creates or expands an agency, government program/function, or tax; creates new regulatory burdens; is hostile to constitutional principles; or otherwise conflicts with the principles that guide the Center. Positive factors were assigned to bills in line with those principles. Companion bills in the House and Senate were weighted identically. To determine the weightings, the Center requested reviews of all chosen legislation from a half dozen engaged Rhode Islanders with similar principles and combined the range of results for a final weighting.

2) Determine vote: Each legislator received a +1 or -1 vote factor, depending on whether he or she voted FOR or AGAINST a particular bill, respectively. If a legislator did not vote on a bill, he or she received a +0.25 if the bill passed or a -0.25 if the bill failed. Legislators who abstained from voting received a +0.75 or a -0.75 vote factor depending on if the bill passed or failed.

3) Calculate weighted vote: Multiplying the weighting factor and the vote factor produced a weighted vote score for each legislator for each bill.

4) Calculate the legislator score:  The cumulative score for all bills for each legislator determined that legislator’s overall score.

5) Calculate Freedom Index: Dividing each legislator’s total score by the maximum possible for the appropriate chamber provided his or her Freedom Index, or a percentage of the best possible score he or she could have achieved. In 2012, the “perfect” scores are 106 for the House and 116 for the Senate.

For example, consider a bill that would increase the regulatory burden significantly in Rhode Island and that the Center therefore weighted as a -2. Legislator A voted for the bill. His or her weighted vote would be calculated as follows: -2 x 1 = -2. Conversely, the weighted vote for Legislator B, who voted against the bill, would be: -2 x -1 = 2.

If Legislator A, in the House chamber, earned a total legislator score of -33, his or her Freedom Index would be calculated as: -33 ÷ 106 x 100 =  -31.1.  If Legislator B in the Senate had a total score of +23, his or her Freedom Index would be calculated as: 23 ÷ 116 x 100 = 19.8.

To rank the legislators, the Center sorted them by their Freedom Index scores and then, in the cases of ties, by their scores in each category, in the following order: Regulatory Environment, Tax & Budget, Constitutional Government, Public Sector Labor, and Education Reform. When legislators’ results were still identical, the Center adjusted them in order of their apparent stature and power within their chambers.

Criteria

In determining each bill’s weighting, the following questions were considered:

  • Does the bill create or eliminate an agency, program, or function of government?
  • Does it give the government new or expanded power to prohibit or restrict activities in the free market? Examples may include licensure and other restrictions on legal business practices.
  • Is it unconstitutional or does it do violence to our concepts of federalism or separation of powers? Does it restrict property, speech, gun, or other constitutionally recognized rights or freedoms? Conversely, does it restore balance between the state and federal government, resume state authority over an issue under the 10th Amendment, or remove restrictions on constitutionally protected rights?

Other considerations were also brought into question:

  • Does the bill redistribute wealth or use tax policy or other incentives to reward specific interest groups with special favors or perks? Conversely, does it eliminate special favors and perks in the tax code or public policy?
  • Does it perform a function that can and should be performed by the private sector or restore functions to the private sector?
  • Does it grow or shrink the regulatory scope of an agency?
  • Does it directly or indirectly create/reduce taxes, fees, or other assessments?
  • Does it increase or decrease control of the private sector through rules, regulation, or statute?
  • Does it increase or decrease long-term debt or override or restore statutory or constitutional protections against long-term debt?
  • Does it give or reduce special benefits for government employees or politicians?
  • Does it promote government transparency and openness or does it restrict access to information that should be in the public domain?

It should be noted that the complexity not only of the law but of political theory in general can make assessments of the sort described above subjective and very difficult. People reviewing the index should consider the results to be the best judgment of the Center, given our collected experience and expertise.

Download: Freedom Index 2012 Scorecardlegislator votes, bill explanations, and rankings

Prosperity Agenda for Rhode Island

Vision

Imagine route I-95 as freeway where human and capital resources start flowing into our state instead of out. Imagine Rhode Island as the most dramatic turnaround state in the USA, with restored economic competitiveness and renewed pride for our citizens. Imagine a reinvigorated economy, new jobs, a world-class educational system, and a return to statewide prosperity.

Unleashing Rhode Island by Tearing Down the Barriers to Success

Rhode Island’s jobs outlook is uniquely dismal in the nation. Further, our state’s failing Report Card demonstrates that a bold, new policy path must be blazed, one that leads us to renewed opportunity and economic growth. In order to enhance the Ocean State’s business climate and to become more competitive with our regional and national neighbors,  we must exit from our current public policy direction.

A handful of major policy reforms and numerous other policy reforms can provide a catalyst for systemic change. For too long, policymakers have focused on providing more government services for more people, attempting to present a balanced budget, but in the end, unwittingly creating even more barriers to economic prosperity. Instead a new public policy course should focus on economic growth and enhancing our capacity to attract and maintain people, investment capital, and businesses.

The recommendations below are merely a starting point. There are dozens of other reforms that are also needed. Over the coming months and years, our Center will add new policy recommendations to this Prosperity Agenda.

High-Impact Policy Reforms:

Among the handful of  “game changing” reforms that would result significant near-term gains for the Ocean State, our Center recommends that Rhode Island:

1) Eliminate the State Sales Tax:  the centerpiece of our Prosperity Agenda; would create over 20,000 new jobs.

2) Establish RI as a “Right to Work” state:  would provide increased worker freedom and would be a major competitive advantage in attracting new businesses to our state.

3) Implement Market-based reforms within Obamacare and Health Insurance Exchange Laws:  As Rhode Island and the nation move forward with implementation of the Affordable Care Act, significant challenges remain regarding access to affordable, quality care while many other issues will be left un-addressed … solution? A  Health Care Freedom Act.

(click on an item above or below to learn more) 

Other Policy Reforms

Rhode Island also suffers from “death by a thousand cuts” syndrome, where dozens upon dozens of laws create barriers to economic growth in our state. Tearing down some of the barriers suggested below are a good start:

4) Bright Today Educational Reformswould increase the educational opportunities and freedom of Rhode Island’s students, especially the disadvantaged.

  1. School Voucher program: would provide special-needs students with a scholarship to attend the school of their choice.
  2. Real Grading of Schools: would grade all public schools in straightforward, universally understood method: A, B, C, D, F.

5) Eliminate Corporate Welfare: would reduce cronyism and corruption, maintain a level playing field, and defund the EDC’s capacity to risk taxpayer dollars on private sector businesses.

6) Implement Tort Reform: would include medical malpractice reforms and a criminal intent provision that protects the innocent.

7) Repeal the Estate Tax: would help keep more wealthy taxpayers in our state, expanding our tax base.

8 ) Lower the Minimum Wage to the Federal Level: would create more jobs, especially for teens, and would reduce the cost of doing business in Rhode Island for many businesses.

9) Reduce Occupational Licensing Mandates: includes five ideas that would open career opportunities and reduce the costs of services without sacrificing consumer safety.

10)  Reform or Repeal Renewable Energy Mandates: would reduce cost of energy for households and businesses, now artificially raised by unreasonable green energy portfolio mandates.

11) Require “Truth in Pension Accounting”: would require municipal and state governments to utilize more realistic accounting assumptions in evaluating and reporting pension liabilities.

12) Enact Collective Bargaining Reforms for Public Employees: would encourage public versus private sector compensation parity, limit the scope of labor contracts, and reduce monopolistic negotiating advantages, potentially saving over $250 million per year for Rhode Island.

PODCAST: 790AM 9-6-12 Stenhouse Podcast ; Mike Stenhouse discusses the PROSPERITY AGENDA on “Positively RI”

Employment Consequences of Kid-Brother Economics

Commentary: Rhode Island’s Follower Plan

Throughout the Great Recession, Rhode Island’s leadership has had the air of helpless wisdom about the predicament of their state’s economy.

“We’re traditionally first into a recession and last out,” Governor Lincoln Chafee (Ind.) told David Klepper of the Associated Press, in December 2011. A few weeks later, RI House Speaker Gordon Fox, arguably the most powerful politician in the state, told WPRI’s Newsmaker interviewers the same thing, almost verbatim.

Nobody in office would say so directly, but general acceptance of that trend has been evident in the priorities and areas of inaction in both the executive and the legislative branches. And when the economic plan is simply to wait for a national recovery to pull the state forward — call it “kid-brother economics” — all that remains is to gloss over the numbers in the meantime.

The Policy Brief

Click here for a PDF of the Policy Brief of RI’s employment trends or read below

See the Media Release at the bottom of this post

The Ocean State’s Unique Status

Rhode Island is suffering through an employment crisis and a jobs outlook more severe than any other state in the country. Residents, hoping to assume more control over their families’ future through some sense of job and wage security, unfortunately, face deteriorating prospects.

No other state in the nation ranks as poorly as Rhode Island in employment when viewed across so many angles. Among all U.S. states:

  1. RI has the second highest unemployment rate in the nation and is one of only three states with unemployment above 10% (NV, RI, and CA). Of them, only RI has a smaller total labor force as compared with prerecession levels.
  2. RI’s unemployment rate would be significantly higher if workers hadn’t given up hope. With its February 2010 labor force, RI’s rate would now be 13.4%; with its January 2007 labor force, it would be 14.2%. Applying the same calculations nationwide, the bottom three would be RI, NV, and AZ in the first case and MI, RI, and IN in the second.
  3. RI is one of only two states significantly below the national norm in measuring current employment versus prerecession peak employment (MI and RI). Of these two, only RI’s trend continues to worsen.
  4. RI is one of only three states that have continued to shed employment since the national employment loss trend ended in February 2010 (RI, AZ, and NY).

When viewed from each of these perspectives, Rhode Island ranks in the bottom two in all four categories. No other state appears more than twice.

Unemployment Is Relative

When it announced the state’s employment results for July, the RI Dept. of Labor and Training (DLT) emphasized the fact that the unemployment rate has been on a slow downward trend. The state’s…

… seasonally adjusted unemployment rate for July 2012 dropped to 10.8 percent, down one-tenth of a percentage point from the June 2012 rate and six-tenths of a percentage point from the previous July. This is the third consecutive monthly decrease in the unemployment rate, and represents the lowest unemployment rate in Rhode Island since May 2009.

While Rhode Islanders are surely in the mood for whatever good news they can get, this may not fill even that modest requirement. That 10.8% does look better than June’s 10.9% and May’s 11.0%, but it still leaves Rhode Island as the runner-up in high unemployment rates, second only to Nevada.

Worse, RI is now one of only three states with unemployment above ten percent, and the others have been exhibiting better trends overall (see Chart 1). Both California and Nevada passed the Ocean State in early 2009, but as 2013 approaches, they’re on pace to drift below, as CA already has.
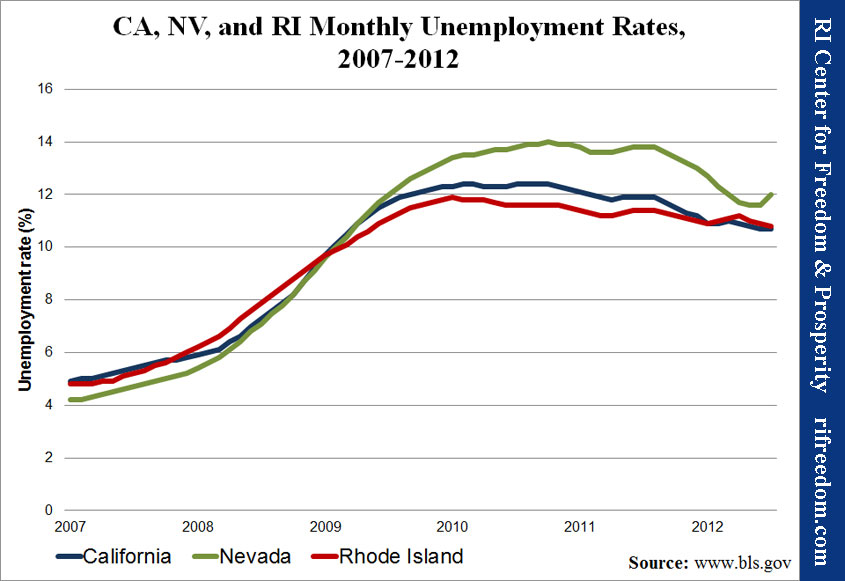
CA, NV, and RI Monthly Unemployment Rates, 2007-2012

The federal Bureau of Labor Statistics (BLS) which compiles employment data for the nation and the states also tracks alternate measures of unemployment. In these cases, the trends are tracked quarterly (every three months), and the number represents the average over four quarters.

The BLS collects its data through a regular Current Population Survey (CPS), which asks respondents a number of questions related to their employment situations. All of the rates shown are percentages of different totals for the “civilian labor force.”

The most common (as represented in Chart 1) is the U-3 measure, which tracks people who are not working, but who want to do so and have looked for jobs within the past four weeks. The denominator for this rate (i.e., the labor force, or 100%) is the total number of people who say they are either employed or looking for work.

Chart 2 shows trends for the U-1 unemployment rate, which traces the number of people who have been unemployed for fifteen weeks or more.
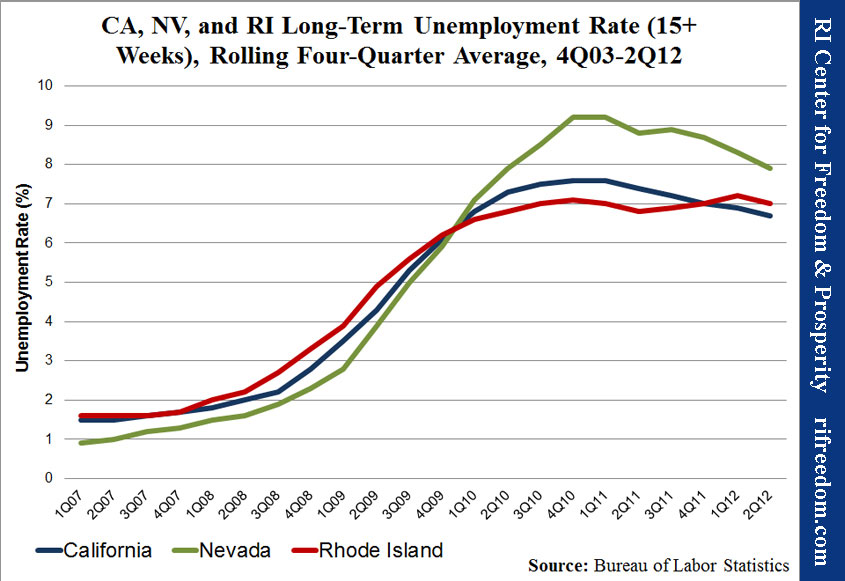
CA, NV, and RI Long-Term Unemployment Rate (15+ Weeks), Rolling Four-Quarter Average, 4Q03-2Q12

Broadening the length of time that residents have been unemployed is one way to adjust the data. Broadening the definition of “unemployed” is another. The BLS digs deeper with survey respondents who are not looking for work by asking when they last did so and why they stopped.

Those who have looked for work within the past year, but stopped no less than four weeks before the survey because they had given up hope of ever finding jobs, are “discouraged.” Broader still is the category for “marginally attached workers,” who followed the same pattern as discouraged workers, but without regard to their reasons for stopping their searches (U-5).

Unemployment trends by this measure are shown in Chart 3. The denominator for the percentage is the labor force defined above plus all marginally attached workers. In this case, Rhode Island still — just barely — has the third worst rate.
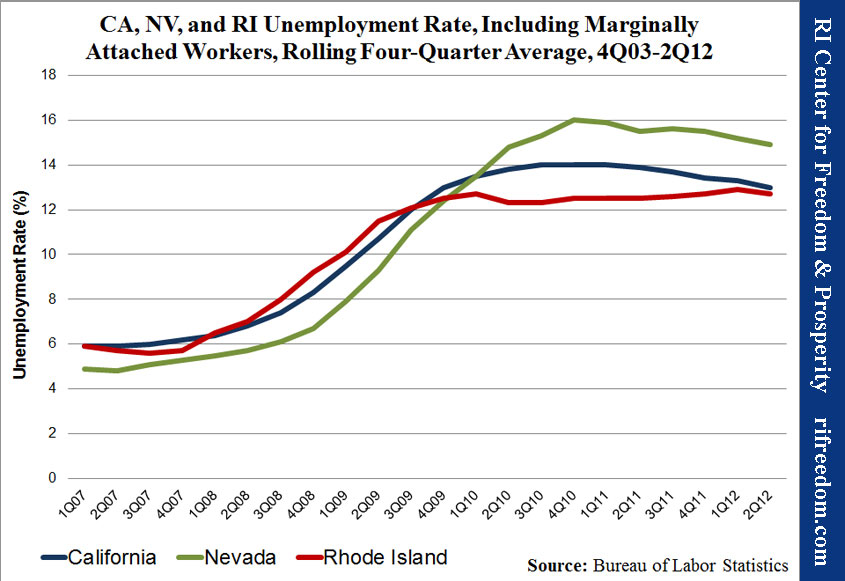
CA, NV, and RI Unemployment Rate, Including Marginally Attached Workers, Rolling Four-Quarter Average, 4Q03-2Q12

The broadest measure of unemployment that the BLS tracks is the U-6, which adds people who are working part time because they cannot find full-time jobs. Comparing Chart 4 with the first three suggests that, when Rhode Islanders find work, it is more likely to be full-time work, in comparison with California and Nevada.
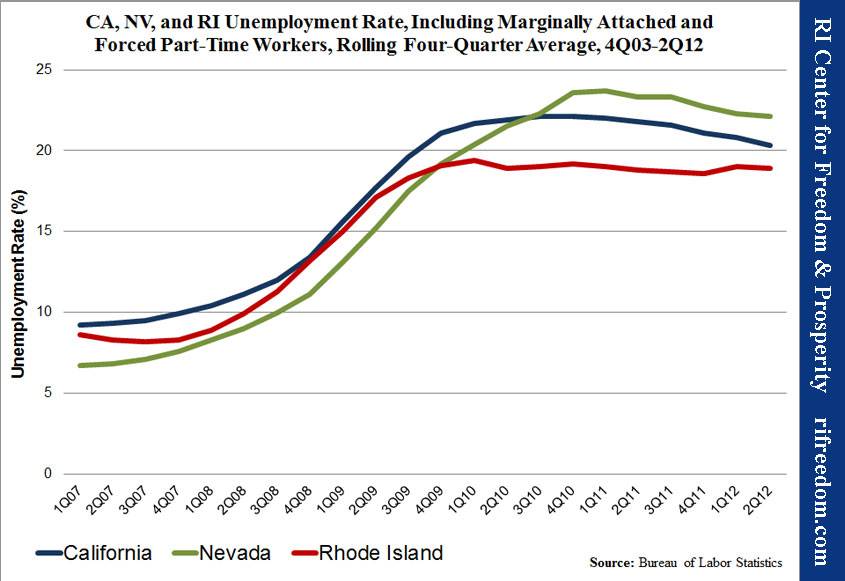
CA, NV, and RI Unemployment Rate, Including Marginally Attached and Forced Part-Time Workers, Rolling Four-Quarter Average, 4Q03-2Q12

Still, with a current rate of 18.9%, that silver lining does not offer much comfort, especially considering that RI’s stagnation remains incontrast with improvement in the other two states.

An Even Gloomier Picture

Unfortunately, even the dispiriting picture of the unemployment rate is overly sunny for Rhode Island. The multiple parts of the unemployment rate equation actually disguise just how badly the recession has hit in the Ocean State. Chart 5 shows what Rhode Island’s unemployment rate would be if its labor force had remained the size it was in January 2007 (at the start of the recession) and in February 2010 (when employment losses receded at the national level).
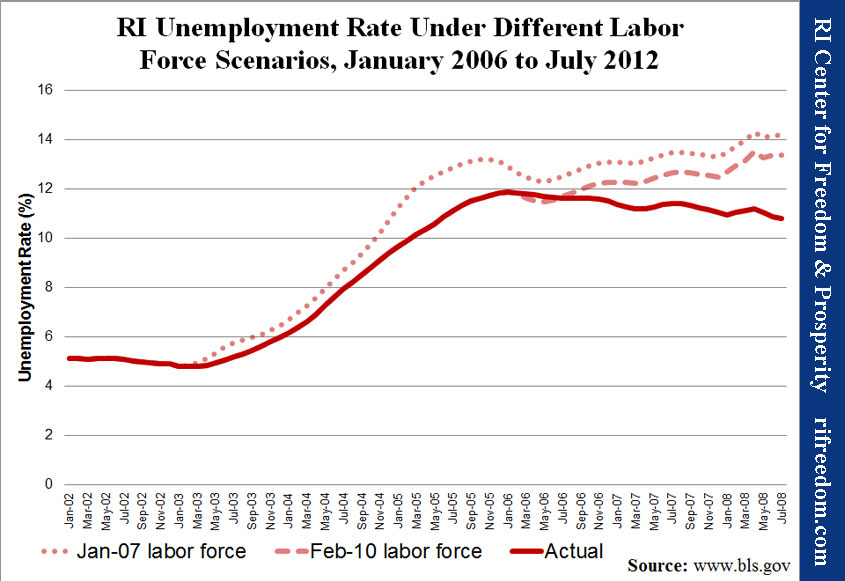
RI Unemployment Rate Under Different Labor Force Scenarios, January 2006 to July 2012

An analysis of total labor force statistics — the actual number of residents working or looking for work — shows that both California and Nevada have seen substantial increases since January 2007, while Rhode Island has seen a substantial decrease. In fact, under the January 2007 labor force scenario shown in Chart 5, both California and Nevada would have unemployment rates below 8%.

In both of those other states with official unemployment currently over 10%, more people wanted to work than before the recession, driving up the unemployment rate. Indeed, the big jump that Nevada experienced in July 2012 (refer back to Chart 1) was amplified by the fact that nearly 2,000 more people were looking for work.

In contrast, so many people stopped looking for work in RI that the unemployment rate could have stayed low even if the economy didn’t create a single job. Employment fell so rapidly that people couldn’t quit the job market fast enough to com-pensate. The two western states had the much more positive task of creating new jobs for new workers.

An Employment Spiral

The fact that the unemployment rate can be misleading, in this way, raises the question of what other measures might give a more accurate picture of the state’s employment trends. One excellent indicator is the number of people employed.

The same BLS survey estimates the number of residents of each state who say that they are working. Chart 6 shows the July 2012 employment number in all fifty states as a percentage of each state’s peak before the housing bust and financial crisis turned its employment growth negative.
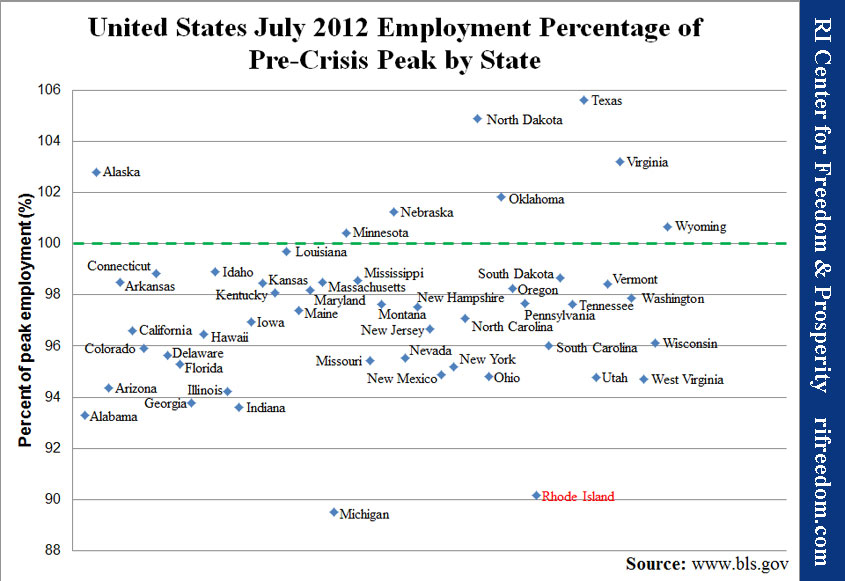
United States July 2012 Employment Percentage of Pre-Crisis Peak by State

Eight states have already surpassed their peaks, and most of the rest are within five percentage points, including California and Nevada. At the bottom of the chart are two outliers that are still around ten percentage points away from their prior level of employment: Michigan and Rhode Island.

Another important question is whether a state’s employment picture is improving. RI’s is not.

Just as Rhode Island has the second worst unemployment rate, it also has the second worst deficit from its peak employment. And just as Nevada is gaining ground on Rhode Island by the first measure, Michigan is gaining ground by the second. That realization, in turn, leads to a final observation of the Ocean State’s condition.

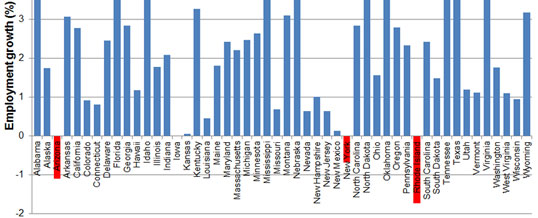
Two years of disappearing jobs in the United States came to an end in February 2010, after which both the number of jobs available and the number of people working began to increase (albeit, slowly and unsteadily). Since then, only three states have continued to shed employment. As Chart 7 shows, not only is Rhode Island once again on that short, undesirable list, but it is dead last… by quite a bit.
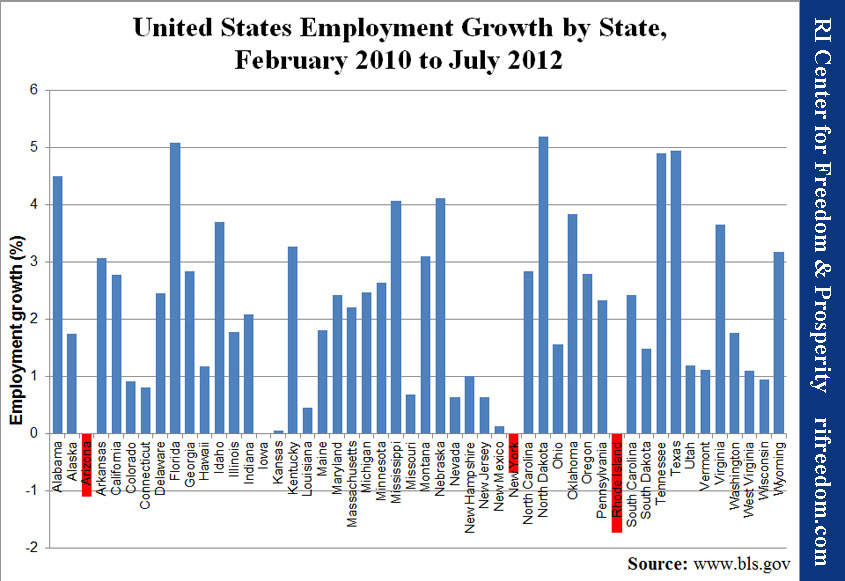
United States Employment Growth by State, February 2010 to July 2012

One Discrepancy

Given the negative trends apparent in this data, it’s important to explain that the employment/unemployment measure is different from the jobs numbers that Governor Lincoln Chafee recently authorized the DLT to release. This brief addresses the number of Rhode Islanders who say that they are employed; the DLT data is based on surveys and tax information from employers regarding the number of employees that they have.

In the latter case, local analysts dispute the BLS’s employer-based statistics, which find a decrease in jobs over the past year. The RI DLT claims an increase of 4,800 jobs from March 2011 to March 2012, while the U.S. BLS claims a decrease of 2,200 over that period.

One potential explanation for at least some of that discrepancy has to do with seasonality. The BLS updates its official employer-based jobs count annually, benchmarking to tax forms. Small-scale surveys suffice for real-time trends.

The RI DLT has broken with this methodology mainly by reviewing unemployment insurance tax data as it becomes available and assuming that the prior year’s seasonal adjustments still apply. Those numbers may require a significant adjustment when the final data is collected if any months were notably different than the same month in the past.

Whichever employer-based jobs number is correct, the data in these seven charts need not be affected. If, for example, people who were already working took additional jobs, the official job growth would have less effect on employment.

Probably more significant is the possibility that Rhode Island employers hired people who do not live in the Ocean State, or that people working in Rhode Island emigrated across the border. In those cases, the number of jobs could go up even as the state’s employment goes down.

An analysis from the Center’s news division, the Ocean State Current, found that the number of people living in the counties right over the border in Connecticut and Massachusetts who are employed increased by almost 11,000 from May 2011 to May 2012, more than twice RI’s new jobs.

Summary Table
Percentage National Rank
Chart 1, U-3 unemployment, July 2012

California

10.7 48

Nevada

12.0 50

Rhode Island

10.8 49
Chart 2, U-1 unemployment 15+ weeks, 2Q12

California

6.7 48

Nevada

7.9 50

Rhode Island

7.0 49
Chart 3, U-5 unemployment incl. marginally attached, 2Q12

California

13.0 49

Nevada

14.9 50

Rhode Island

12.7 48
Chart 4, U-6 unemployment incl. marginally attached and involuntary part time, 2Q12

California

20.3 49

Nevada

22.1 50

Rhode Island

18.9 48
Chart 5, unemployment with January 2007 labor force, July 2012

Indiana

10.7 48

Michigan

16.4 50

Rhode Island

14.2 49
Chart 5, unemployment with February 2010 labor force, July 2012

Arizona

11.8 48

Nevada

12.9 49

Rhode Island

13.4 50
Chart 6, distance from prerecession employment peak, July 2012

Alabama

-6.7 48

Michigan

-10.5 50

Rhode Island

-9.8 49
Chart 7, employment growth since February 2010, July 2012

Arizona

-1.1 49

New York

-0.7 48

Rhode Island

-1.7 50


Time to Take Responsibility

Overall, Rhode Island’s picture is what one would expect when the officials who control the overly burdensome threads of government place the status quo above progress. The state’s economy has been stagnant and drifting downwards, as Rhode Islanders for whom stagnation is not good enough make other plans.

The kid brother who never takes responsibility or initiative for himself will tend to trail behind, much as Gov. Chafee and Speaker Fox passively describe their state’s economy. That should not be accepted; too many Rhode Islanders are being harmed and finding their aspirations put on hold.

***

Media Release

FOR IMMEDIATE RELEASE:  September 4, 2012

RI Uniquely Suffers Bleak Employment Outlook

Governor Chafee Should Consider Facts Before Speaking to National Audience from Charlotte

As Rhode Island Governor Chafee prepares to speak to a national audience from the DNC Convention one day after Labor Day, he should consider that his state suffers from the bleakest labor outlook of any state in the nation, according to a report issued today by the RI Center for Freedom & Prosperity. The state-based think tank also criticized the governor and other state leaders for their inaction and announced plans to release its own set of recommended policy reforms.

The report shows that Rhode Island is alone in ranking in the bottom two states in the nation with regard to its unemployment rate, its continuing workforce and employment degradation, and its overall employment loss since both the recession and the recovery. The state is unique in its poor standing across all of these important job measurement categories.

“As we have been saying for months, absolutely nothing is being done to improve our alarming jobs slump,” said Mike Stenhouse, CEO for the Center. “Why are we not having a special session of the General Assembly this fall?” he inquired.

“We’re traditionally first into a recession and last out,” Gov. Chafee told David Klepper of the Associated press, in December 2011.1 A few weeks later, RI House Speaker Gordon Fox, arguably the most powerful politician in the state, told WPRI’s Newsmaker interviewers the same thing, almost verbatim. This general attitude has translated into inaction in both the executive and the legislative branches. “It is not a viable economic plan to simply to wait for a national recovery to pull the state forward,” added Stenhouse.

Citing today’s report as irrefutable evidence of the need for immediate and bold reforms to provide Ocean State residents with renewed opportunities and long-term financial security for their families, the RI Center for Freedom & Prosperity also announced that it will offer its own solutions to address one of the biggest challenges in the state’s history.

“We have the second highest unemployment rate in the nation… and our General Assembly does nothing. We are one of only three states that has lost employment since February 2010… and this administration does nothing. We have the worst business climate in the nation… and our business and political leaders do nothing! Our jobs crisis has resulted in a decade-long loss of taxpayers to other states… and the political class does nothing,” continued Stenhouse. “The inaction of our do-nothing politicians has cost our state jobs because of their politics-as-usual approach. Our Center does not cave to special interests and we are not afraid to act. We will provide a positive vision for our state, along with a well-researched set of policy reforms to solve our dismal jobs problem.”

In filling part of the leadership void in the state, the Center plans to publish tomorrow its Prosperity Agenda for Rhode Island, which will recommend a dozen significant policy reforms. “Hopefully, our Center’s employment report today and our suggested policy reforms tomorrow will spur the debate that Rhode Island must have now! We encourage voters and candidates to reject the political class’s approach of doing nothing and, instead, to raise awareness of this vital problem and openly discuss all legitimate solutions during the upcoming campaign season,” concluded Stenhouse.

The Rhode Island Center for Freedom and Prosperity, a non-partisan public policy think tank, is the state’s leading free-enterprise advocacy organization. With a credo that freedom is indispensable to citizens’ well-being and prosperity, the Center’s mission is to stimulate a rigorous exchange of ideas with the goal of restoring competitiveness to Rhode Island through the advancement of market-based reform solutions.


North Kingstown Employees Strike to Maintain Public-Sector Premium

One question lost in the heat of this school year’s example of the annual opening-day labor dispute is: Why should school children pay more for janitorial services than anybody else would?  The practical answer is that parents are very sensitive to the treatment of their children, and that’s just one of the points of leverage that public-sector unions have.

According to the North East Independent, writing in July, janitors in North Kingstown used to make $19.47 per hour. Since the school committee voted to switch from the in-house union to the private GCA Services Group, while keeping the same workers, that hourly rate has fallen to $15.17. That’s a substantial drop of 22%, and it comes with greatly inferior benefits.  But in Rhode Island’s continuing jobs recession and apparent economic decline,  it isn’t clear that public-sector jobs, especially in schools, ought to be notably inviolable.

Data from the U.S. Bureau of Labor Statistics, last compiled in May 2011, shows the median hourly wage for “janitors and cleaners, except maids and housekeeping cleaners” in Rhode Island at $11.82. The average wage is $13.03, indicating that a small number of janitors make much more than that.  Despite the substantial cut, the North Kingstown crew is still among those high-wage outliers.

In this regard, the North Kingstown School Department is merely providing the latest example of a fact that the RI Center for Freedom & Prosperity highlighted in January: public-sector unions drive labor costs well above the market rate. The Center cited a study by the Goldwater Institute finding that a ban on collective bargaining and contracts in the public sector could save the state $252 million.  Keep in mind that this total is state workers only.

Goldwater found that, overall, the nationwide premium that taxpayers pay for the workers under their employ is 44% over the private sector.  Before the North Kingstown School Committee’s action, this summer, the janitors on its payroll were well above even that.

Rhode Island Employment Snapshot, July 2012

Rhode Island’s unemployment rate fell a tenth of a point in July, to 10.8%, still second only to Nevada.  But the results are far from positive; they aren’t even “mixed.”  More people lost their jobs, and even more gave up looking for work.

The first chart below shows the trends in labor force (employed and looking for work) and employment since the beginning of the recession in January 2007.  The second chart shows the labor force and employment pictures for Rhode Island, Massachusetts, and Connecticut as each state’s current percentage of January 2007.

Rhode Island Labor Force and Employment, January 2007 to July 2012


RI, MA, and CT Labor Force and Employment, July 2012 Percentage of January 2007

R.I. Creating an Expressway to Dependency

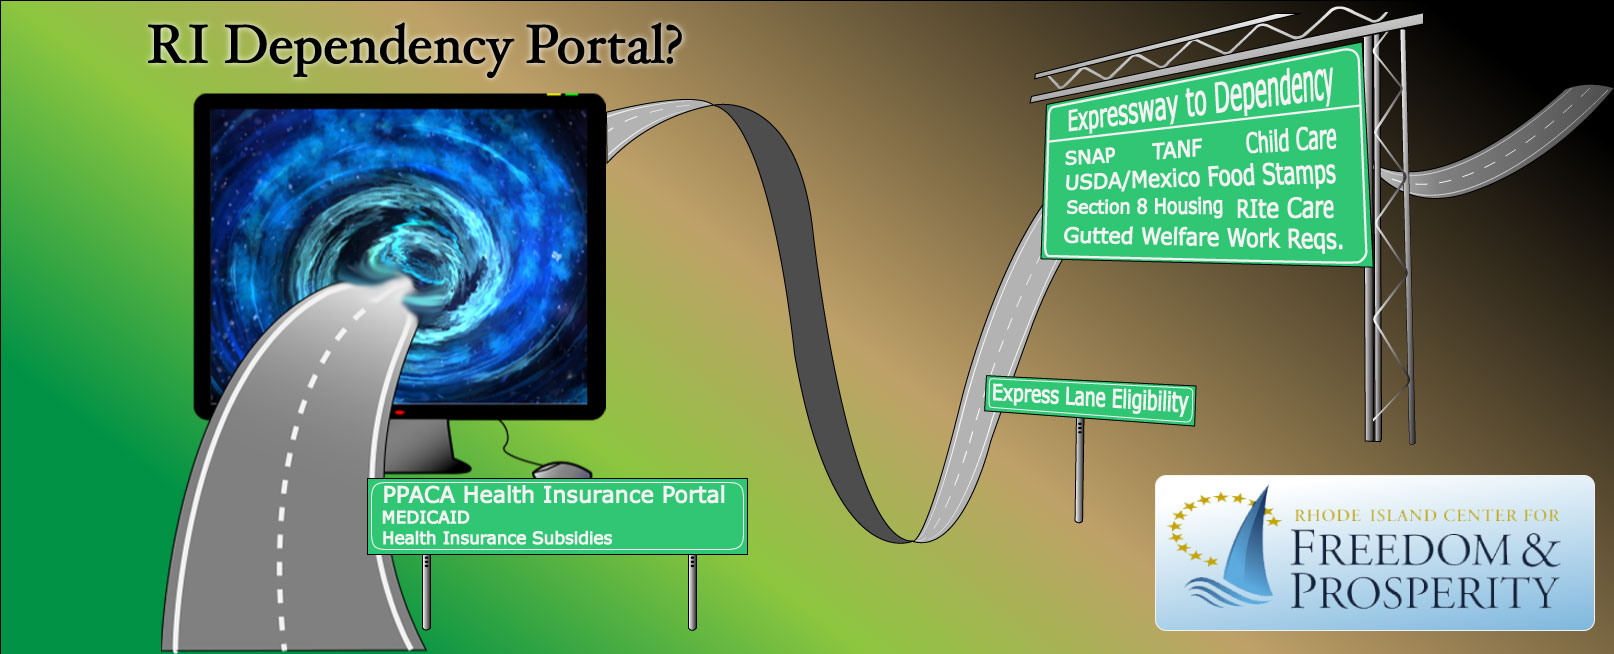
The Issue. Rhode Island is leading the nation in the advancement of a larger entitlement culture via its planned expansion of social services through a health benefits exchange, a component of the controversial federal healthcare law. When collecting detailed personal financial and household information from individuals seeking health insurance support, the state intends to proactively enroll participants in other state programs for which they are eligible. Will this create and expanded culture of dependency?

Statement from CEO, Mike Stenhouse. “This is an extreme case of misguided public policy. The expansion of government and special interest control over our personal healthcare decisions, along with the culture of dependency being freely advocated by this administration, should be viewed as an assault on our deeply held American value of self-reliance.

“Imagine turning to the RI health benefits portal because your employer cancelled your insurance and finding yourself on a government-created expressway to a life of dependency. Wouldn’t we all be better off, instead, if the state encouraged residents to become independent, productive members of society?”

Related LinksMike Stenhouse discusses the ‘Dependency Portal’ on the Helen Glover radio show … click hereDependency Portal Pieces in Place;

What the Center is calling a “dependency portal.”  The dependency portal is a not-so-hidden goal of Rhode Island’s version of the health benefits exchanges described in the Patient Protection and Affordable Care Act (PPACA, commonly known as ObamaCare).

Although the final design has not been developed in specific detail, the idea of the exchanges is to enable healthcare consumers to use a government Web site to review their available options for insurance and to determine their eligibility for public subsidies.  Most likely, a series of Web-based forms will ask the user for a variety of highly personal information regarding health, income, and family circumstances in order to determine what health plans and public assistance amounts he or she is eligible for.

Whether such information will be requested of all residents who seek to use the site or only of those explicitly seeking subsidies remains an open question.

The exchange will become a dependency portal when other forms of public assistance — from food stamps to cash-payment welfare to child-care subsidies — are integrated into the system and promoted to the exchange user based on information that he or she provides while seeking health coverage — perhaps automatically enrolling people with the merest expression of consent.

At a recent press conference, Rhode Island Health and Human Services Secretary Steven Costantino referred to this “hidden element” of the exchanges as “one-stop shopping.”

Why is that bad? As a free market think tank, the Center is certainly not opposed to practices that encourage efficiency and the use of technology to improve the access that customers and clients have to services. Information technology, in particular, has empowered individuals to accomplish easily and inexpensively tasks that once required expert consultants.

From a business perspective, the Internet and the proliferating technologies that use it, now including smartphones and tablets, smooth the path from a potential customer’s initial interest all the way to final purchase.  Technology enhances businesses’ ability to market and sell their products and services, and they seek to accomplish those ends in order to grow their revenue and expand their market share.

That model is not appropriate to government in dispensing taxpayer-funded services.

In the private sector, bundling of services has become commonplace, and it is easy to understand why companies would pursue the strategy.  Think of the merging technologies of television, Internet, and telephone; it makes sense for a company with an advantage in, say, television, to use various marketing techniques, such as reduced-price packages, cross advertising, and one-stop shopping, to gain an edge in other markets.

However, the public clearly has a sense that these methods can go too far.  Indeed, at the turn of the millennium, the federal government sued Microsoft on the grounds that it was hindering competition by using its operating system dominance (with Windows) to gain an insurmountable advantage in the Web browser market (with Internet Explorer).

In the case of government, all of the same incentives exist for the organization to expand its reach.  The difference is that government has three inherent competitive advantages:

  1. In its ability to simply confiscate money to pay for, or at least subsidize, its services
  2. In the fact that the people whom it entices to its services are not paying their full cost
  3. In its control of the marketplace by means of regulation

Over time, government programs are therefore less and less “public services” that taxpayers agree to support through the people whom they elect and more and more bureaucratic offerings that use the enrollment of some citizens as justification for claiming more authority and confiscating more money from others.

One can see evidence of this intention in the process by which Rhode Island’s exchange was initiated.  In the face of (to be mild) public uncertainty about the PPACA, the Democrat president and Congress pushed it through.  It creates financial incentive for states to build the exchanges (by making taxpayers from other states pay for it), and it hands an astonishing amount of policy discretion to the unelected Secretary of Health and Human Services.

In Rhode Island, Governor Lincoln Chafee broke with common understanding of separation of powers in order to create the exchange by means of executive order, committing the state to pay for the site’s maintenance once it is operational.  Similarly, the state executive branch has simply determined to agree to a related Medicaid waiver, expanding free healthcare services in the state and adding to its expenses.  No legislative input; no public hearings; in short, no public statement of agreement with the programs being developed in the people’s name.

As the government exchanges claim increasing shares of the market nationally, unelected state and federal officers will be authorized to determine everything from minimum benefits to price controls to payment schedules.  The board that Governor Chafee appointed to initiate the exchange illustrates that special interests will have an outsized role, as well.

With the addition of other welfare programs to the mix, it will be even more difficult for the people of the state to change course.

What it means for you. Losing control of activities done in the public’s name may not be the most dire consequence of the dependency portal approach.  Rather, the fatal part of the trap is the fast lane to a culture of universal reliance on government and a pervasive sense of entitlement.

Whenever the topic of welfare arises, conversation turns toward those who “know how to work the system” and thus become the fabled “welfare queens.”  For them, incentives toward good behavior have been reduced or reversed, and democracy has devolved into an exchange of political power for handouts.

The real danger of the dependency portal is that it sets up a chute so that previously self-reliant Rhode Islanders will increasingly fall into an entitlement existence.  Why else would the exchanges offer health care subsidies to a family of four with income of $92,200?

Just as technology has simplified tasks that once required expert consultants, the dependency portal will make “working the system” a simple matter of clicking a few buttons.

Tracing the progress of the portal in Rhode Island. RI Health & Human Services Secretary Steven Costantino, Health Benefits Exchange Director Christine Ferguson, and Lt. Governor Elizabeth Roberts describe Rhode Island’s nation-leading steps toward the dependency portal (June 28, 2012):


Elaboration on why Rhode Island and the United States should resist the pull toward dependency portals:

RI Center for Freedom & Prosperity first identifies the dependency-portal dynamic as one reason to reject the health benefit exchange and the Medicaid expansion:

The pieces needed to turn the exchange into a dependency portal are being put into place:

RI officials acknowledge intention to implement Medicaid expansion, without any indication of legislative or public input:

Documents related to the dependency portal begin to reveal the direct connection between those pushing the concept and those involved with Rhode Island’s health benefits exchange:

The dependency portal in concert with eliminated work requirements for welfare may mark the return of the “welfare queen” and a “majority coalition” for big-government activists:

Documents. The federal government and national non-profits describe the dependency portal and the related “express lane eligibility”:

Rhode Islanders must act if they want better life

Do we want to be an Entitlement State or a State of Prosperity?

OpEd by Mike Stenhouse; as published in the Providence Journal (7-29-12)

What kind of state do Rhode Islanders really want? Who will provide the vision and leadership that will lead to renewed opportunities and prosperity for our citizens?

Rhode Island has the second highest unemployment rate in the nation, yet our political leaders do nothing about it.

Ours is the worst ranked state in terms of business climate, yet our business leaders do not cry out.

We have one of the highest state and local tax burdens in the country, yet citizens remain silent.

We have dangerously high unfunded pension and benefit liabilities, yet the political class does nothing to help our municipalities.

We are losing population and wealth to neighboring states and throughout the country, yet the defenders of the status quo stick their heads in the sand and say “it isn’t so.”

We have the most burdensome level of health-insurance mandates in the nation, yet the Chafee administration is pushing us towards even more government control of our personal health-care decisions.

We have the highest sales tax in New England, yet our political class actually voted to expand the tax, even to some of the poorest among us.

Soon, research from our center will show that Rhode Island is uniquely positioned in the nation as a failing economic state, yet most members of the local media do not raise awareness or seek accountability from our public officials.

The list could go on and on, but the real question is whether Rhode Islanders really want to continue down the same path that has failed our state so miserably or if we can find the willpower to tear down the barriers that have prevented us from increasing our quality of life.

Do we as a people want to live in an entitlement state or in a state of prosperity? One could reasonably assume, based on the above pattern of apathy, that we collectively want the former. But I doubt that.

So what is a concerned citizen to do? Especially when there is no leadership coming from policy-makers?

With the 2012 election rapidly approaching full campaign mode, the choice cannot be clearer for voters. There are two starkly different visions for our state: one that defends a status quo that tries to centrally engineer our society; and one that promotes bold reforms that restore individual control of our lives and a positive sense of self-determination to our citizens.

Whether you are an average Joe (or Joe-Ann), a business owner or a student, it is important that you understand your duty as a vigilant citizen and that you are empowered to make a difference. First, you can think about and develop a core set of political principles that will guide you. Second, you can become educated about the issues and encourage discussion and debate within your various circles of friends, family and colleagues. Third, you can become actively engaged by supporting organizations, campaigns, or policy initiatives that are consistent with your core principles.

This summer and fall, you can stand up where others have fallen down. Demand of candidates who knock on your door, call your home, or conduct town-hall-type meetings to clearly tell you whether they will defend the status quo or whether they will openly support the bold reform initiatives that our state so desperately needs.

Reforms like: lowering sales, income and corporate taxes; like providing school choice for students condemned to a failing school; like implementing patient-centered health-care reforms vs. government-centered; like constructive collective bargaining reform for government workers.

As a state we can choose to perpetuate our downward spiral by allowing to stand the government regulations that infringe upon our freedoms and limit our capacity to thrive; or, we can choose to begin to rebuild our economy by unleashing the great potential within each of us. The choice is indeed yours — and ours — to make; especially when most everyone else is afraid or incapable of leading!

Mike Stenhouse is the chief executive of the Rhode Island Center for Freedom and Prosperity, a conservative think tank.

Related Commentary: 2013 Budget Fails to be Bold