Mike Stenhouse: R.I.’s complacent political class

Originally Published In The Providence Journal On July 7, 2016:

Rhode Island has the worst business climate in the nation. It ranks 48th on both the Family Prosperity Index of the American Conservative Union and the Jobs and Opportunity Index of our Rhode Island Center for Freedom and Prosperity. It has virtually zero population growth, and it has suffered the ignominy of dozens of other near-bottom rankings. Despite all this, our Rhode Island political class appears content not to rock the boat.

When we hear boasts that there were no broad-based tax increases in the recently passed state budget, we hear an attitude of complacency that is typical of the political elite, whose main goal is to perpetuate the status quo, as opposed to making the hard decisions that will improve the quality of lives of its residents.

The irony, of course, is that our political leaders seem to genuinely believe that they have made major positive reforms. Maybe, relatively speaking, they just don’t understand what major reform looks like.

Years ago, when our center sought to paint a more complete image of the state’s jobs picture, we found that Rhode Island, along with Indiana and Michigan, ranked among the bottom three states in terms of recovery of employment from pre-recession peaks. Faced with an obviously unacceptable status quo, two of these three states took bold and major action. One state did not. Can you guess which one?

First Indiana, then recently Michigan, enacted right-to-work laws that provided workplace freedom for employees and that also gave employers new incentives to establish or grow businesses in their states. Since then, Indiana has rocketed up to 20th on this same employment index, while Michigan is already on the climb at 44th.

These are examples of the bold kind of political leadership and major reform that can quickly transform the prosperity of the people and businesses in our state.

Conversely, the meager reforms put forth this year by Ocean State politicians pale in comparison and will do very little to help the average family in any meaningful way. As in recent years, the negative legislation outweighed the good. Million-dollar studies and fancy new names for programs that perpetuate the same kind of special-interest, 38 Studios-type preferential tax policies that are responsible for driving Rhode Island into a rut in the first place, are nothing new — and certainly are not anything bold.

And while other states are decisively moving forward, Rhode Island is falling in the wrong direction. Only briefly out of the bottom three, our Ocean State is back wallowing as the second worst state when it comes to recovering lost employment, with West Virginia in last place. But West Virginia politicians chose not to accept this fate and sit idly by. Earlier this year, the Mountain State became the nation’s 26th state to pass right-to-work laws, also repealing prevailing-wage mandates that artificially drive up the cost of public works projects.

If Rhode Island’s complacency continues — both by our political class and by voters who re-elect it year after year — we will soon see Rhode Island lose one of its two congressional seats and shamefully slip to last place when it comes to renewing hope and opportunity for our families.
Rhode Island needs to dare to disrupt the status quo and boldly evolve itself into a regional outlier so that we can become a magnet — on our own — for businesses, jobs and families.

Instead, our political class wants us to devolve into a dependent suburb of Boston’s economy. We need to think bigger.

Rhode Island politicians will not have the chance to change their act until next year. However, voters can lead the way by acting this year to deliver a clear message at November’s ballot box.
In this wild and unpredictable year of national politics, the big question is whether or not the tsunami of public discontent will reach our Ocean State shores and compel voters to send a necessary jolt to our political class.

STATEMENT on Proposed 2017 RI Budget

STATEMENT: FOR IMMEDIATE RELEASE 
June 8, 2016

RI Families Once Again Left Out of State Budget

Multiple Special Interest & Corporate Welfare Programs Outweigh Few Relief Provisions
Lawmakers Adopt Center’s Recommendation to increase EITC in lieu of Minimum Wage hike

Providence, RI — With nothing bold to address the massive structural budget deficits, its dismal business climate, or the state’s 48th ranking on the RI Center for Freedom & Prosperity‘s Jobs & Opportunity Index, Rhode Island lawmakers are once again advancing a special interest laden agenda that offers little relief or hope for new opportunities for the average Rhode Island family.

“What does the average family have to cheer about in this budget? The few provisions that offer minor relief to some are overwhelmingly outweighed by the massive special interest and corporate welfare spending that will continue drag-down our state economy,” commented Mike Stenhouse, CEO for the Center. “Only when the total relief package is bigger than new spending can we claim that Rhode Island is heading in the right direction.”

While recognizing the reductions in retiree income taxes, the corporate minimum tax, and trucker registration and beach parking fees, the Center notes that these cuts are themselves narrowly targeted and are more than offset by the increases in corporate welfare, new Uber and marijuana taxes, pre-K funding, and new special-interest bond initiatives.

The Center maintains that major broad-based tax reforms are required to jump-start the Ocean State’s stagnant economy and jobs market.

Also according to the Center, the continued funding of the unethical legislative and community grant programs, despite the mirage of reform, can only be seen a perpetuation of a corrupt, status quo insider culture.

As help to low-income workers, the Center praises lawmakers for adoptng the Center’s March 2016 recommendation to hold the minimum wage steady and, instead, increase the Earned-Income-Tax-Credit (EITC), which rewards work without risking job losses.

Jobs Opportunity Index (JOI) is a Better Metric than Unemployment Rate

There is no JOI in Mudville … Ocean State strikes out – ranking 48th – in in the Center’s new Jobs & Opportunity Index of economic well-being, despite recent celebrations of traditional unemployment rate. JOI was designed to help lawmakers craft better policy.

Stop the HPV Vaccine Mandate & Preserve Parental Rights

REGULATORY DESPOTISM? To view our press conference videos, photos, media links, and for more info …

Go to our HPV home page

2015 Ed Choice Legislation – The Way of the Future!

If enacted, the Bright Today Scholarship and Open Enrollment Act of 2015 would become the most innovative and universal school choice program in America! Education Savings Accounts (ESAs) are the way of the future.

[button url=”https://rifreedom.org/?p=13364″ target=”_blank” size=”medium”] Read the ESA policy brief here [/button]

Will RhodeMap RI Lead to Demolished Neighborhoods in RI?

The San Francisco Bay area regional authority, similar to the “Urban Redevelopment Authority” that the controversial RhodeMap RI plan would create, plans to demolish 169,000 single-family homes, despite the outrage and objections of residents.

[button url=”https://rifreedom.org/?p=13267″ target=”_blank” size=”medium”] Read the full post here [/button]

RI General Assembly 2014 Session Freedom Index

Download: Freedom Index 2014 Scorecard; legislator votes, bill explanations, and rankings

Go to main Freedom Index page.

NOW LIVE! Interactive Scorecard

2014 Freedom Index Findings

Ninety-nine (99) different pieces of legislation (counting companion bills once) were evaluated.  The Center judged 76 of them as having a negative effect on freedom.

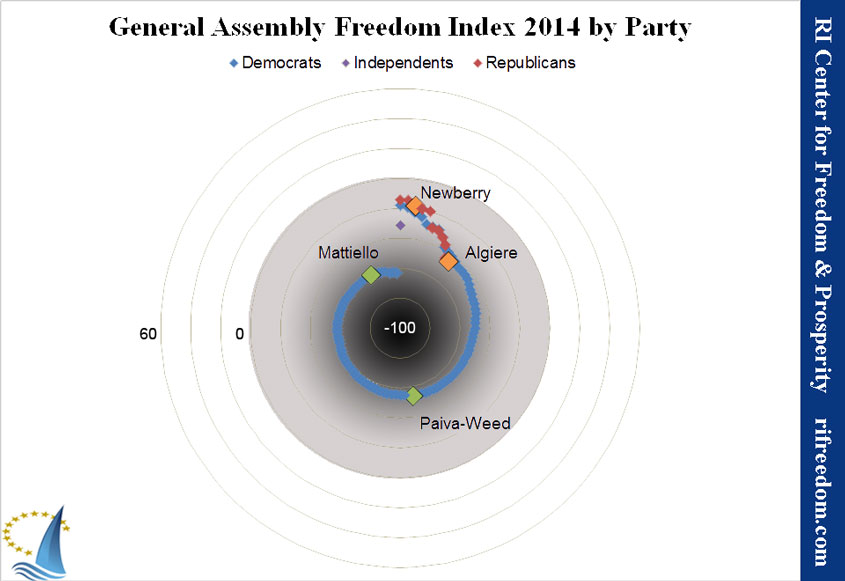
The average legislator index score of -49.4 indicates that the General Assembly moved Rhode Island in the wrong direction, and that Rhode Islanders are less free than they were in 2013. That result does represent a modest improvement from -56.6 the previous year.  (The lowest possible score is -100.)  However, it’s important to remember that it’s only an improvement in that the General Assembly is harming Rhode Island at a slightly slower rate. Actual improvement has yet to be made.

This index underscores our Center’s view that the RI General Assembly continues not to positively address the dire business climate of our state and that a Constitutional Convention may be the only way to move the Ocean State toward growth and an improved standard of living.

freedom-index-spiral-2014-web

Other findings include:

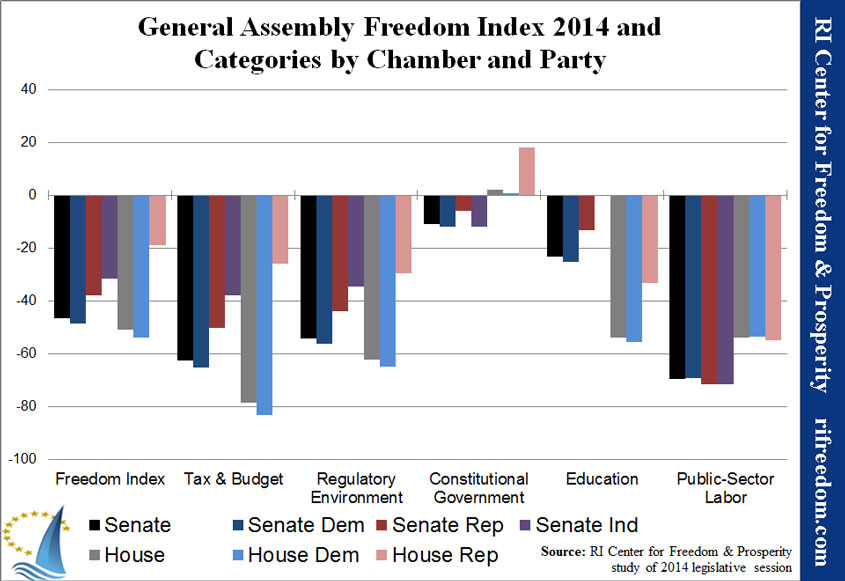
  • Average House index of -51.0 (up from -58.6)
  • Average Senate index of -46.7 (up from -52.4)
  • Average House Democrat index of -53.8 (up from -63.1)
  • Average House Republican index of -19.1 (down from -7.1)
  • Average Senate Democrat index of -48.5 (up from -56.1)
  • Average Senate Republican index of -38.0 (down from -33.2)
  • Average Regulatory Environment index of -47.1 (up from -67.5)
  • Average Tax & Budget index of -56.4 (down from -37.2)
  • Average Constitutional Government index of -4.8 (up from -61.6)
  • Average Public Sector Labor index of -69.5 (down from -44.0)
  • Average Education Reform index of -23.1 (up from -86.4)

ricfp-freedomindexandcategories2014-web

RI General Assembly 2013 Session Freedom Index

Download: Freedom Index 2013 Scorecard;   legislator votes, bill explanations, and rankings 

The second-annual General Assembly Freedom Index by the RI Center for Freedom & Prosperity scores Ocean State lawmakers on their level of support for principles of freedom as proven by their votes on the floors of the House and Senate. In response to IRS proposals that would limit the activities of non-profit groups like our Center, the Center released its initial version with legislators names redacted, identifying them only by chamber, party, and district (Read related commentary here). The full, non-redacted version is now released.

The index examines legislators’ votes in terms of their likely effect on the free market, the size and scope of government, the balance of residents’ interests against those of public employees and beneficiaries, and the constitutional structure of a divided government with limited power over the people whom it represents. The Center reviewed every bill that received a roll-call vote by the full membership of either chamber and selected 96 that fit its understanding of these criteria. (Companion bills only count once.)

The resulting scores give a detailed sense of each legislator’s priorities beyond a few high-profile issues.

The Center further divided the bills into five categories:

  • Tax & budget:  bills that affect the tax structure in Rhode Island and/or that relate to government expenditures, just driving or relieving the pressure on taxation
  • Regulatory environment: bills that make it more or less difficult to live and do business in the state by imposing regulations
  • Constitutional government: bills that affect the structure of the government, as well as the scope of government in its authority over residents’ lives
  • Public sector labor: bills related to the relationship between its employees and itself and the electorate
  • Education reform: bills that advance or impede the reform of the state’s public education system, in terms of both cost and quality

Most legislation has implications for more than one of these categories.  For the purposes of this index, we applied our subjective sense of the area of core effect and sorted the bills accordingly.  If, for example, a bill having to do with education seemed to us intended to secure the role of public employees, we classified that bill as Public Sector Labor, not Education Reform.

Download: Freedom Index 2013 Scorecard; legislator votes, bill explanations, and rankings 

2013 Freedom Index Findings

One hundred and sixteen (116) different pieces of legislation (counting companion bills once) were evaluated.  The Center judged 93 of them as having a negative effect on freedom.

The average legislator index score of -56.6 indicates that the General Assembly moved Rhode Island in the wrong direction, and that Rhode Islanders are less free than they were in 2012. What’s more, that result is down from -25.4 the previous year.  (The lowest possible score is -100.)  In other words, legislators aren’t even trending in the direction of the right direction. This index underscores our Center’s view that the RI General Assembly continues not to positively address the dire business climate of our state.
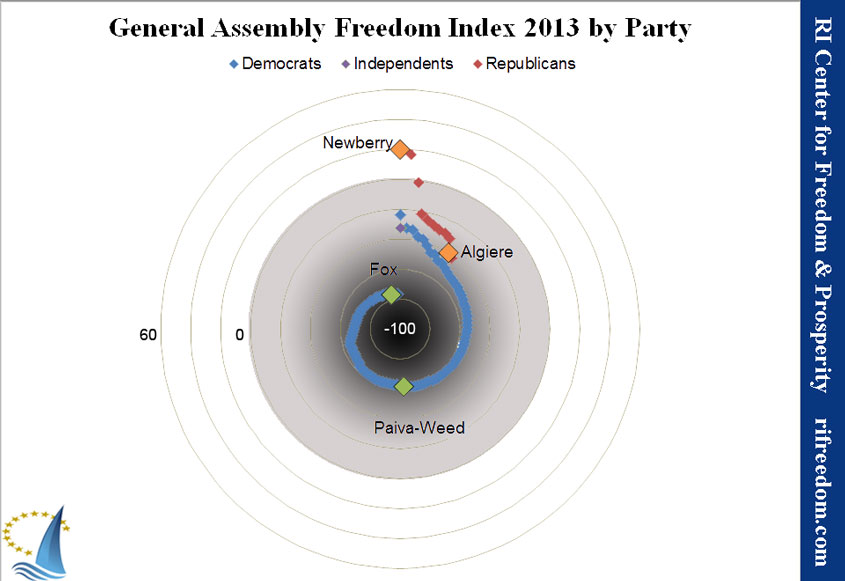
freedom-index-spiral-2013-web

Other findings include;

  • Average House index of -58.6 (down from -24.1)
  • Average Senate index of -52.4 (down from -27.9)
  • Average House Democrat index of -63.1 (down from -32.2)
  • Average House Republican index of -7.1 (down from 28.8)
  • Average Senate Democrat index of -56.1 (down from -36.3)
  • Average Senate Republican index of -33.2 (down from 1)
  • Average Regulatory Environment index of -67.5 (down from -49.0)
  • Average Tax & Budget index of -37.2 (down from -26.0)
  • Average Constitutional Government index of -61.6 (down from -9.1)
  • Average Public Sector Labor index of -44.0 (down from 16.7)
  • Average Education Reform index of -86.4 (there were no bills in this category last year)
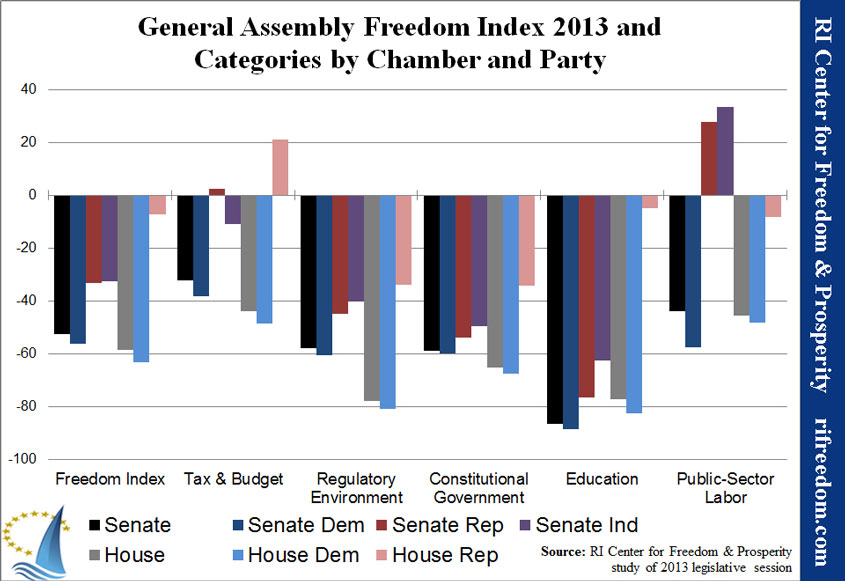
ricfp-freedomindexandcategories2013-web


Index Overview

The Center selected legislative bills for inclusion in the Freedom Index if they were deemed to have an effect on free-market, small-government, or constitutional principles, with each bill assigned a positive or negative weighting based on the criteria listed below. Weighted points for each bill were given to each legislator based on his or her roll-call vote on it.

Each legislator’s final Freedom Index was calculated as his or her score’s percentage of the total possible points. A positive score indicates a 2013 voting record that generally protected individual and economic freedoms, while a negative score reflects the opposite.

Disclaimer: It should be noted that the total Freedom Index score generated for each legislator is a direct reflection of the perspective of the RI Center for Freedom & Prosperity when it comes to the weighting of each bill. The Freedom Index is not an absolute measure of a legislator’s merit and does not constitute any endorsement or individual criticism. The Freedom Index is a tool designed for general research and for accountability, giving voters some quantitative metrics for their own assessments as to their elected legislators’ performance. 

Methodology

1) Determine weighting: Each selected bill received a weight ranging from +3 to -3, as determined by the RI Center for Freedom & Prosperity. Negative weights indicate legislation that creates or expands an agency, government program/function, or tax; creates new regulatory burdens; is hostile to constitutional principles; or otherwise conflicts with the principles that guide the Center. Positive factors were assigned to bills in line with those principles. Companion bills in the House and Senate were weighted identically. To determine the weightings, the Center requested reviews of all chosen legislation from a half dozen engaged Rhode Islanders with similar principles and combined the range of results for a final weighting.

2) Determine vote: Each legislator received a +1 or -1 vote factor, depending on whether he or she voted FOR or AGAINST a particular bill, respectively. If a legislator did not vote on a bill, he or she received a +0.25 if the bill passed or a -0.25 if the bill failed. Legislators who abstained from voting received a +0.75 or a -0.75 vote factor depending on if the bill passed or failed.

3) Calculate weighted vote: Multiplying the weighting factor and the vote factor produced a weighted vote score for each legislator for each bill.

4) Calculate the legislator score:  The cumulative score for all bills for each legislator determined that legislator’s overall score.

5) Calculate Freedom Index: Dividing each legislator’s total score by the maximum possible for the appropriate chamber provided his or her Freedom Index, or a percentage of the best possible score he or she could have achieved. In 2012, the “perfect” scores are 143 for the House and 133 for the Senate.

For example, consider a bill that would increase the regulatory burden significantly in Rhode Island and that the Center therefore weighted as a -2. Legislator A voted for the bill. His or her weighted vote would be calculated as follows: -2 x 1 = -2. Conversely, the weighted vote for Legislator B, who voted against the bill, would be: -2 x -1 = 2.

If Legislator A, in the House chamber, earned a total legislator score of -33, his or her Freedom Index would be calculated as: -33 ÷ 143 x 100 =  -23.1.  If Legislator B in the Senate had a total score of +23, his or her Freedom Index would be calculated as: 23 ÷ 133 x 100 = 17.3.

To rank the legislators, the Center sorted them by their Freedom Index scores and then, in the cases of ties, by their scores in each category, in the following order: Regulatory Environment, Tax & Budget, Constitutional Government, Public Sector Labor, and Education Reform. When legislators’ results were still identical, the Center adjusted them in order of their apparent stature and power within their chambers.

Criteria

In determining each bill’s weighting, the following questions were considered:

  • Does the bill create or eliminate an agency, program, or function of government?
  • Does it give the government new or expanded power to prohibit or restrict activities in the free market? Examples may include licensure and other restrictions on legal business practices.
  • Is it unconstitutional or does it do violence to our concepts of federalism or separation of powers? Does it restrict property, speech, gun, or other constitutionally recognized rights or freedoms? Conversely, does it restore balance between the state and federal government, resume state authority over an issue under the 10th Amendment, or remove restrictions on constitutionally protected rights?

Other considerations were also brought into question:

  • Does the bill redistribute wealth or use tax policy or other incentives to reward specific interest groups with special favors or perks? Conversely, does it eliminate special favors and perks in the tax code or public policy?
  • Does it perform a function that can and should be performed by the private sector or restore functions to the private sector?
  • Does it grow or shrink the regulatory scope of an agency?
  • Does it directly or indirectly create/reduce taxes, fees, or other assessments?
  • Does it increase or decrease control of the private sector through rules, regulation, or statute?
  • Does it increase or decrease long-term debt or override or restore statutory or constitutional protections against long-term debt?
  • Does it give or reduce special benefits for government employees or politicians?
  • Does it promote government transparency and openness or does it restrict access to information that should be in the public domain?

It should be noted that the complexity not only of the law but of political theory in general can make assessments of the sort described above subjective and very difficult. People reviewing the index should consider the results to be the best judgment of the Center, given our collected experience and expertise.

Download: Freedom Index 2013 Scorecard; legislator votes, bill explanations, and rankings 

Each legislator received a +1 or -1 vote factor, depending on whether he or she voted FOR or AGAINST a particular bill, respectively. If a legislator did not vote on a bill, he or she received a +0.25 if the bill passed or a -0.25 if the bill failed. Legislators who abstained from voting received a +0.75 or a -0.75 vote factor depending on if the bill passed or failed.

Spotlight on $pending Report

OVER $220 MILLION IN WASTEFUL SPENDING detailed.

When the political class says it can’t be done … this is how to pay for tax and other reforms!

School Choice Essay Contest Winners

Read Tiffany’s essay here …  Read Bryan’s essay here …  Listen to Tiffany and Bryan on the Helen Glover Radio Show 920WHJJ-AM

Media Release: July 31, 2013

Providence, RI — In celebrating “Friedman Legacy Day 2013”, the RI Center for Freedom & Prosperity will award prizes today to Tiffany Rezendes and Bryan Morillo, the top two essayists in a private essay contest it conducted with the youth-run empowerment organization, People United For Change, based in the Wiggins Village section of Providence.

Friedman Legacy Day is an annual celebration of the life and work of Milton Friedman, a Nobel Prize winning economist and one of the early pioneers of school choice in America. Today would have been Friedman’s 101st birthday.

Tiffany Rezendes and Bryan Morillo were announced as the top two essayist in the 2013 Milton Friedman Legacy Day Essay Contest celebration. Thanks to People United for Change for partnering with our Center.

Tiffany Rezendes and Bryan Morillo were announced as the top two essayist in the 2013 Milton Friedman Legacy Day Essay Contest celebration. Thanks to People United for Change for partnering with our Center.

Essayists were asked to write about how school choice has, or may have, made a difference in their lives or in someone they know. Both winners attended Providence district schools and each will receive an IPad donated by a Board member of the Center.

“A major assertion of Milton Friedman was echoed as a common theme in the personal essays we received; namely, that poor families are most affected by a lack of school choice,” said Mike Stenhouse, CEO of the Center. “He believed that residents of low-income neighborhoods, more than any other population, are disadvantaged as to the quality of schooling they can get for their children.”

Rezendes, 20, wrote about how one of her closest friends dropped out of high school due to a lack of a challenging curriculum in her Providence school, with no option to choose a school that was better suited to her interests, and how “she just gave up once she found out she wasn’t accepted into Classical because all her hopes of having a great education had to be lowered to settle for a below average school experience.”

Morillo, 17, discussed how lack of choice in schools “condemned the students of providence (sic) to an attitude of ‘sit at home and collect a check’ … ” because of a curriculum that left many “unprepared for the real world”, and “making it easy to simply go through the motions …”

People United for Change is a youth-run organization based at Wiggins Village in Providence, focused on empowering people to bring about positive and meaningful change, through unity, to the city of Providence and the state of Rhode Island.

Read Tiffany’s essay here …

Read Bryan’s essay here …

ABOUT the Contest

The School Choice Essay Contest asked students to write about how school choice could have positively affected their life, or someone close to them. Essays were scored from 1-10 in each of four categories: emotional appeal, realism, defense of school choice, and quality of writing. Each of the five judges read and scored each essay.

JUDGING PANEL

Dr. Angela Dills, PhD – Economics Professor, Providence College. Doctor Dills has championed school choice for several years through research and speaking.

Matthew Fabisch – Attorney, Stephen Hopkins Center for Civil Rights. Matt has worked extensively on the legality and principles surrounding school choice.

Creusa Michelazzo – Providence-based small business owner. Macremi specializes in PR, production, and community/business development.

Akash Chougule – Outreach Coordinator, RI Center for Freedom. Akash conducts the Center’s youth outreach to state and national liberty organizations.

Tyler Tassinari – Student, Arizona State University and Center Intern. Tyler is spending his summer doing school choice research for the Center.