Rhode Island NAEP in Context: Improvement Hit Ceiling in 2011
HALT IN EDUCATION REFORM PRODUCED DROP IN STUDENT TEST SCORES. Every two years, the National Center for Education Statistics releases state-level results from the National Assessment of Educational Progress (NAEP) test. Since 2001, the federal government has required all states receiving Title I funding (that is, all states) to conduct the tests in reading and mathematics at the fourth and eighth grade levels. NAEP, also known as “the nation’s report card,” is therefore the most accurate tool for comparing public school performance across all states, Washington, D.C., and the schools operated by the U.S. military.
[Click here for the printable one-page PDF of this report]
To assist Rhode Islanders and those from other states in understanding and visualizing their states’ results, the RI Center for Freedom & Prosperity maintains an interactive online application that allows users to view the data from multiple perspectives, bringing out trends and illustrating comparisons.
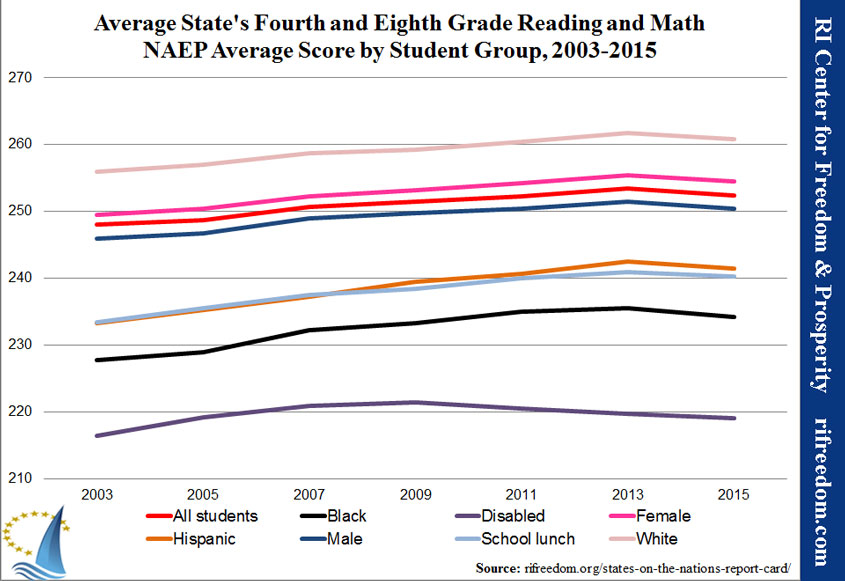
Two of the first observations that users should make are that Rhode Island is essentially the average state and that this puts the Ocean State at the back of the New England pack. Massachusetts leads both New England and the country.
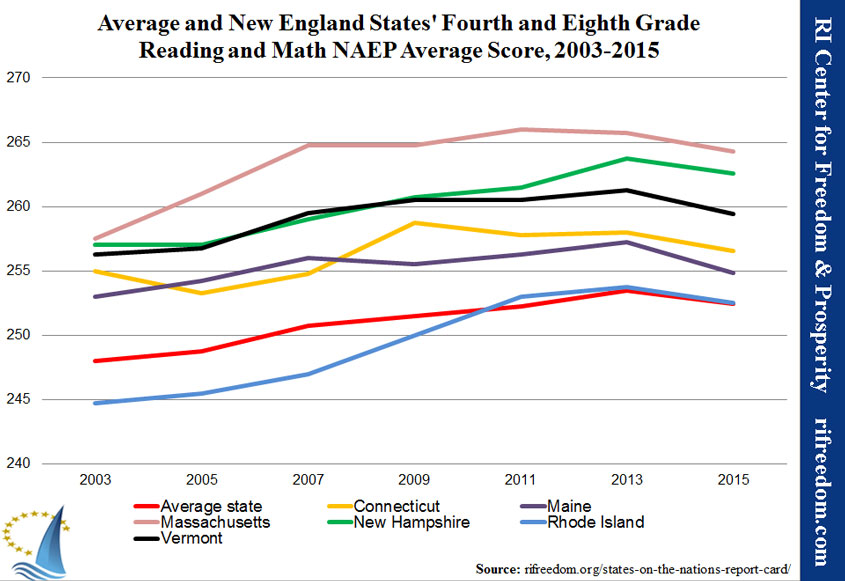
Looking at long-term trends shows that, throughout the last decade, Rhode Island made substantial gains, narrowing the gap with the rest of New England and slightly overtaking the average state, with minority students gaining the most ground. That progress ended, however, in 2011, corresponding with Democrat Governor Lincoln Chafee’s overhaul of the state education board and the General Assembly’s push to stop reforms that former Commissioner Deborah Gist had begun implementing under former Republican Governor Donald Carcieri.
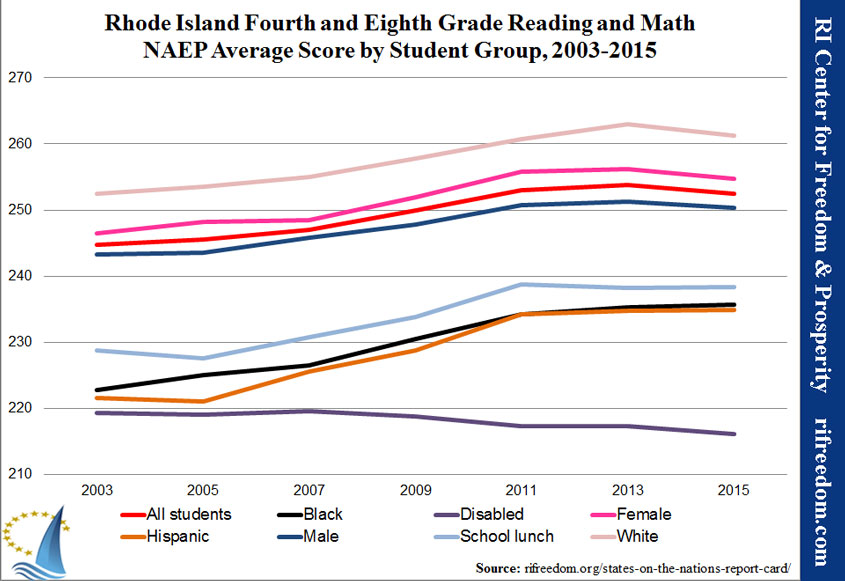
With the most recent test, in 2015, Rhode Island’s overall scores dropped along with the average for the United States. In general, Rhode Island has done better in reading and in fourth grade than in math or eighth grade.
Looking at demographic groups, disabled students have experienced more than a decade of slow-but-consistent decline in Rhode Island, from a little above the average state to a little below. In 2003, black and Hispanic Rhode Island students were performing at a level not much above disabled students, but by 2011, they had closed roughly half of the gap with the state’s average for all students. That progress hit a ceiling with Governor Chafee’s changes, that year.