NOVEMBER JOBS SNAPSHOT: Lower Unemployment Rate Paints Inaccurate Picture
FOR IMMEDIATE RELEASE
December 21, 2015
RI Unemployment Rate Again Paints False Picture
Center to publish new Jobs & Opportunity Index in 2016
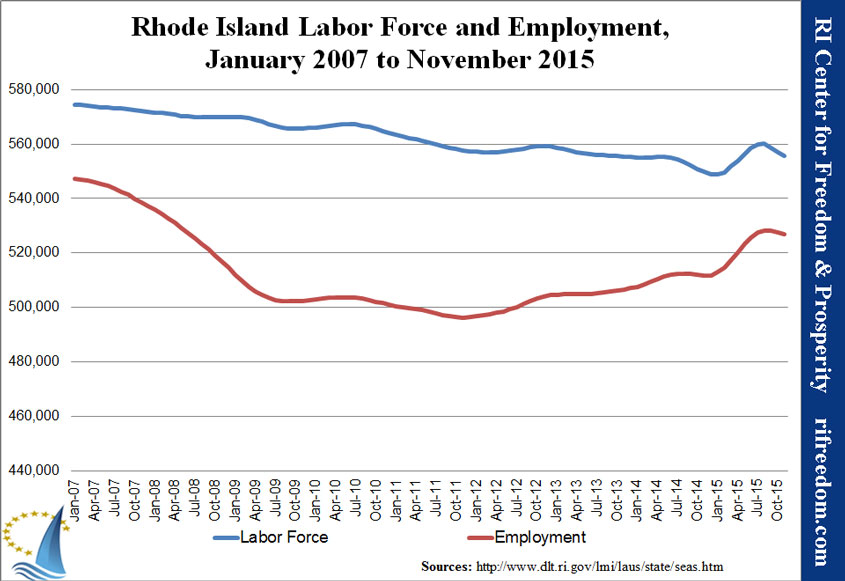
Providence, RI — For the second month in a row, the November unemployment rate for Rhode Island appears to paint an incomplete and misleading snapshot of the true jobs and economic picture in the state, according to a monthly analysis by the nonpartisan RI Center for Freedom & Prosperity. As in October, the lower state unemployment rate, seemingly a positive, was the result of two negative pieces of data: lower overall employment and a smaller labor force (a result of people giving up looking for work).
While the U.S. Bureau of Labor Statistics (BLS) measures six levels of unemployment, U1 thru U6, it is only the U3 unemployment rate that is the basis for the official monthly unemployment rate: U3 narrowly measures the number of unemployed people as a percentage of the labor force. However, U3 is largely dependent on labor force size; so in keeping with the trend of recent months in Rhode Island, when the labor force drops, usually considered a negative economic indicator, it generally produces a lower U3 unemployment rate, which is conversely seen as a positive.
In November of 2015, Rhode Island’s unemployment rate dropped to 5.2%, from 5.3% in the prior month. But, similar to October data – employment levels actually dropped (by 770 people) and 1,461 Rhode Islanders gave up looking for work, thus shrinking the labor force.
“To hear politicians crow about our state’s lower unemployment rate is misguided,” said Research Director Justin Katz, “two losses don’t make a real gain; and this pattern has persisted for years. There’s much more going on in our state that lawmakers should be aware of.”
Among the specific findings in the November analysis:
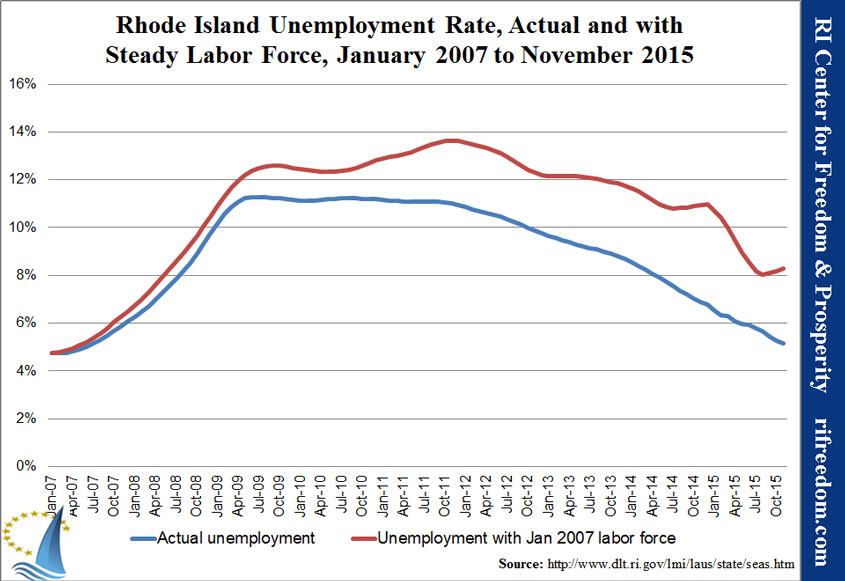
- RI’s unemployment rate would have increased to 8.3% if the state had maintained the same size labor force at it had before the recent recession
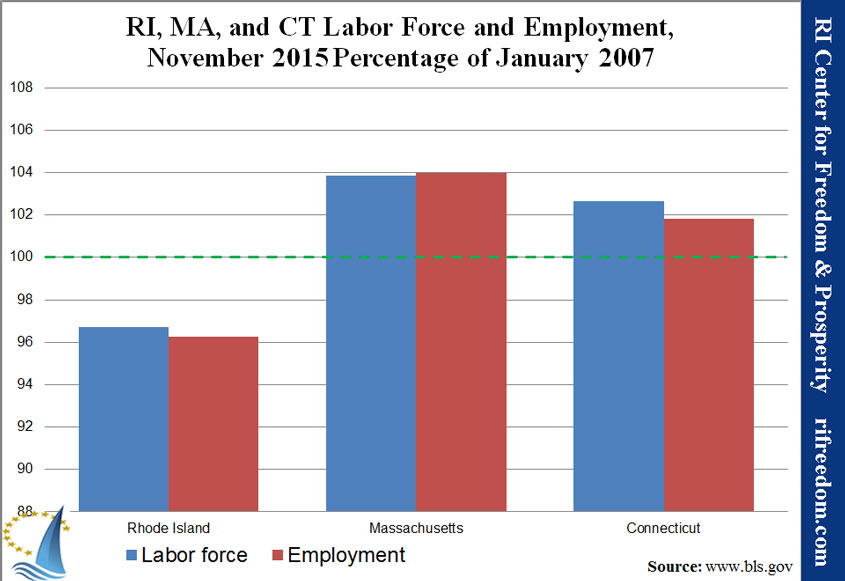
- RI lags far behind its MA and CT neighbors in terms of recovering its employment and labor force levels since before the recent recession
For graphs, charts and a more detailed analysis of Rhode Island’s November employment status click here.
New JOI Index in 2016: In order to account for this labor force vs unemployment rate contradiction and to provide Rhode Islanders with a broader and more accurate picture of the state’s actual jobs market, in Q1 of 2016, the Center plans to publish a monthly Jobs & Opportunity Index, which will incorporate other BLS unemployment categories and which will also measure the size and scope of the state’s private sector as compared with the size and scope of state government.