
POLL: Why Rhode Islanders Want a Constitutional Convention
See the results of our September poll about how Rhode Islanders feel about the state of their state; includes actual words from your neighbors.
Rhode Island Employment Snapshot, September 2014: What RI Worry?
Rhode Island was one of only 14 states to lose employment in September, according to data from the federal Bureau of Labor Statistics (BLS). Unemployment in the Ocean State fell to its lowest level since June 2008 (7.6%), but the “improvement” of that metric continues to result from the fact that more people are giving up and leaving the labor force than are losing their jobs, each month.
The first chart below shows the large (and likely-to-be-revised-downward) increase in employment through the first half of the year, plus the more modest increase and more rapid decrease in the labor force. Together these factors shaved almost two percentage points off the unemployment rate over the past year.
The second chart shows that both Massachusetts and Connecticut continue to surpass, or be close to, their peak labor forces and employment. Both other Southern New England states saw increases in employment in September.
The third chart shows that the unemployment rate would have increased to 11.0% in September, from 10.9% in August, if Rhode Island’s labor force hadn’t shrunk so much since the beginning of the recession.


Delegation from Warren Ranks Last in Freedom Index
Go to Freedom Index Home page
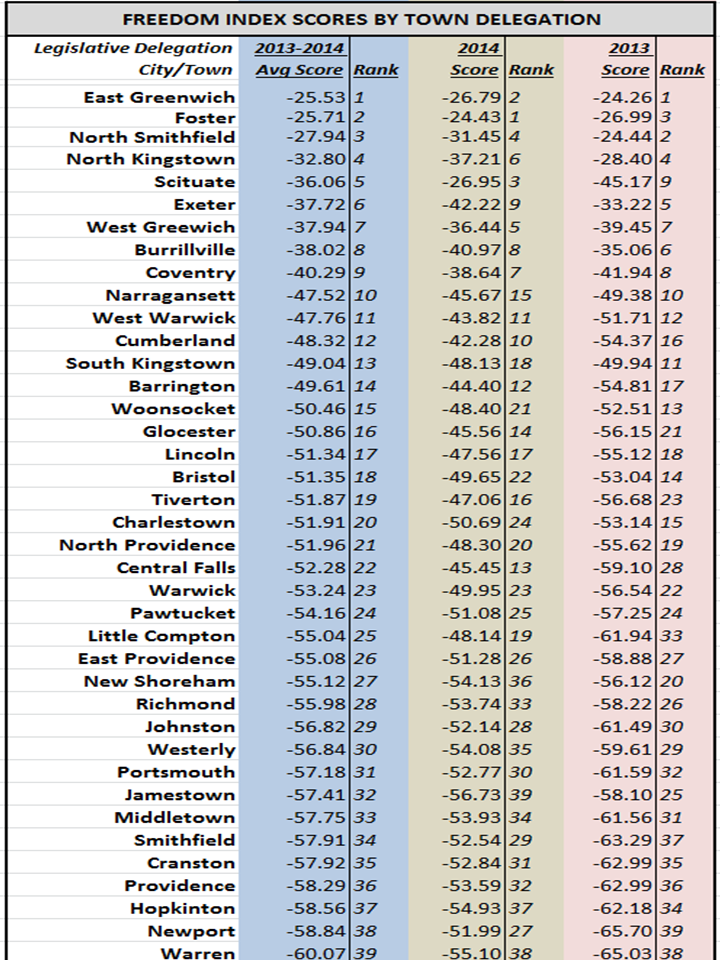
Warren Last, East Greenwich First
In 2013-14 Freedom Index Rankings
Based on the Freedom Index scores of the General Assembly delegations from each of the 39 cities and towns in Rhode Island, Representatives and Senators from the town of Warren, as a group, scored the lowest; indicating that this group voted on legislation that most infringed the individual, economic, or educational freedoms of Rhode Islanders. Conversely, and despite scoring a negative number itself, the delegation from East Greenwich ranked at the top of the list, meaning votes from its legislators least infringed on our freedoms.
Our land, our rights, our local government
Originally published in the Providence Journal, October 20, 2014
– Read Governor Chafee’s OpEd Response
– Center/Stenhouse Response – Related Media Release
See public comment letter submitted by the Center
The American Dream once meant ownership of land and a home, with a white picket fence around the yard, as a symbol of independence and a step toward prosperity. To others today, that dream is being reduced to living in a multi-use tenement building, with a rail around a small balcony, in a socially-engineered collectivist society.
It was the design of our nation that each state should be an independent laboratory, largely free of centralized control. It is widely held that local government is better government — most reflecting the will of the people it serves. Similarly, it is understood that land-use and zoning decisions are best made by locally elected officials. These core principles are the basis of our American society.
Urban planning can be an effective tool in providing for growth of population and services, in maintaining these core principles, and in advancing local values and traditions. Conscientious planners should attempt to balance public benefit against potential loss of property rights. To manage these issues, we understand that related decisions are best made by local officials, accountable to their community.
However, the federal government has recently been pushing and funding a centralized approach, often referred to as “sustainable development.” In creating regional planning entities funded by federal grants, and run by unelected ideologues accountable to no one, this approach turns the local planning process on its head.
In 2012, Rhode Island became the first state to formally cede a major portion of its economic development and planning rights to the federal government when it accepted grant funds from the Department of Housing and Urban Development to create a so-called economic development plan that advances a “social equity” agenda that considers private-property ownership to be unfair. This agenda incorporates radical elements from the environmentalist and “social justice” movements, even to the extent where racial quotas could be implemented to determine who will be allowed to live in certain cities and towns.
In the Ocean State, a little-known plan is being aggressively advanced behind the scenes: It is called RhodeMapRI. While its cozily worded claims of benefits may seem attractive, experience with similar plans has shown that serious unintended — perhaps intended — consequences have undermined core principles that Rhode Islanders hold dearly. Urban planning should never supersede the rights of private citizens or the authority of local governments.
The goals of this movement are to force development of high-density “walkable” communities that meet radical social equity standards and that, ostensibly, reduce carbon emissions. By positioning its suggested reforms in attractive “affordable housing,” “social equity” and “environmentally responsible” language, the true intentions of the movement, also called “smart growth,” may severely limit levels of private property ownership and related property rights.
By focusing only on professed benefits, and covering up high costs and many pitfalls, regional sustainable planning acolytes often slip their agendas through, before local officials and residents realize what is going on. It is then often too late to do anything about it. Just Google “Westchester County Agenda 21.”
Among the many unsustainable problems created by RhodeMapRI could be:
•States and counties ceding their sovereignty to federal government agencies.
•Municipalities giving up much local authority to newly created regional non-governmental entities.
•Wasted money spent on an overly-idealistic urban agenda that would further depress our economy.
•Blocking paths to property ownership and infringing on rights of property owners.
•Transportation restrictions discouraging the use of private vehicles.
•Social equity and radical environmentalism as the standards against which future land-use proposals will be measured.
•Over-aggressive affordable-housing mandates that result in reduced and inequitable local property tax levies (as is happening now in Woonsocket and Barrington).
•Oppressive zoning statutes and liberal eminent domain laws that decrease property values.
RhodeMapRI is not an economic development plan. It is a ruse. It is an extreme social-engineering scheme that will serve to throttle economic growth at a time when the Ocean State can least afford it. Property owners, beware.
There are more questions than there are answers about RhodeMapRI and all Rhode Islanders are encouraged to voice their concerns at one of the upcoming public hearings on Oct. 27 and 28.
Who are these people who have written this massive and intrusive plan? Certainly not elected officials from Rhode Island!
For such an elaborate plan that will impact future decades for our state, why just two public sessions in the final week of a major election campaign? What are they trying to hide?
Mike Stenhouse is CEO for the Rhode Island Center for Freedom and Prosperity, a nonpartisan public policy think tank.
Public forums for the RhodeMapRI plan will be held on Oct. 27 at 6 p.m. at the Powers Building, One Capitol Hill, Providence; and Oct. 28 at 6 p.m. at North Kingstown Senior Center.

RI General Assembly 2014 Session Freedom Index
Download: Freedom Index 2014 Scorecard; legislator votes, bill explanations, and rankings
Go to main Freedom Index page.
NOW LIVE! Interactive Scorecard
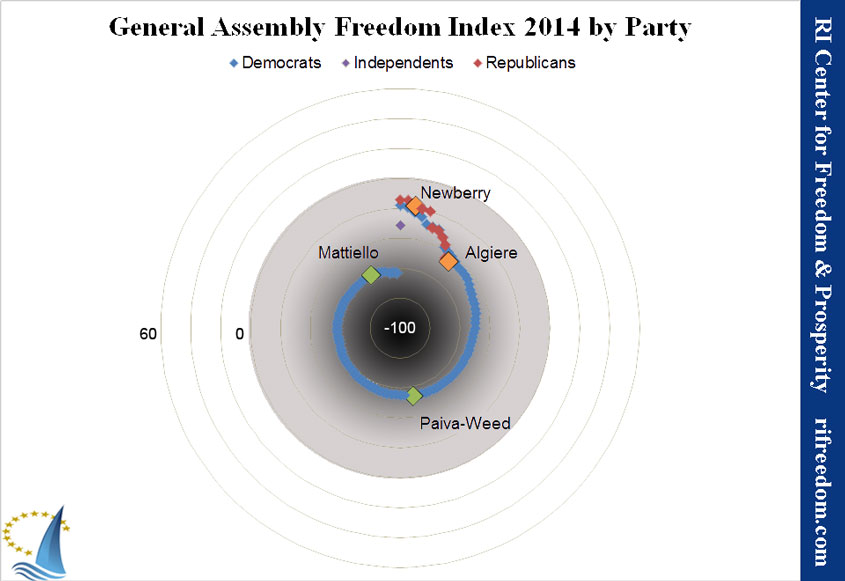
2014 Freedom Index Findings
Ninety-nine (99) different pieces of legislation (counting companion bills once) were evaluated. The Center judged 76 of them as having a negative effect on freedom.
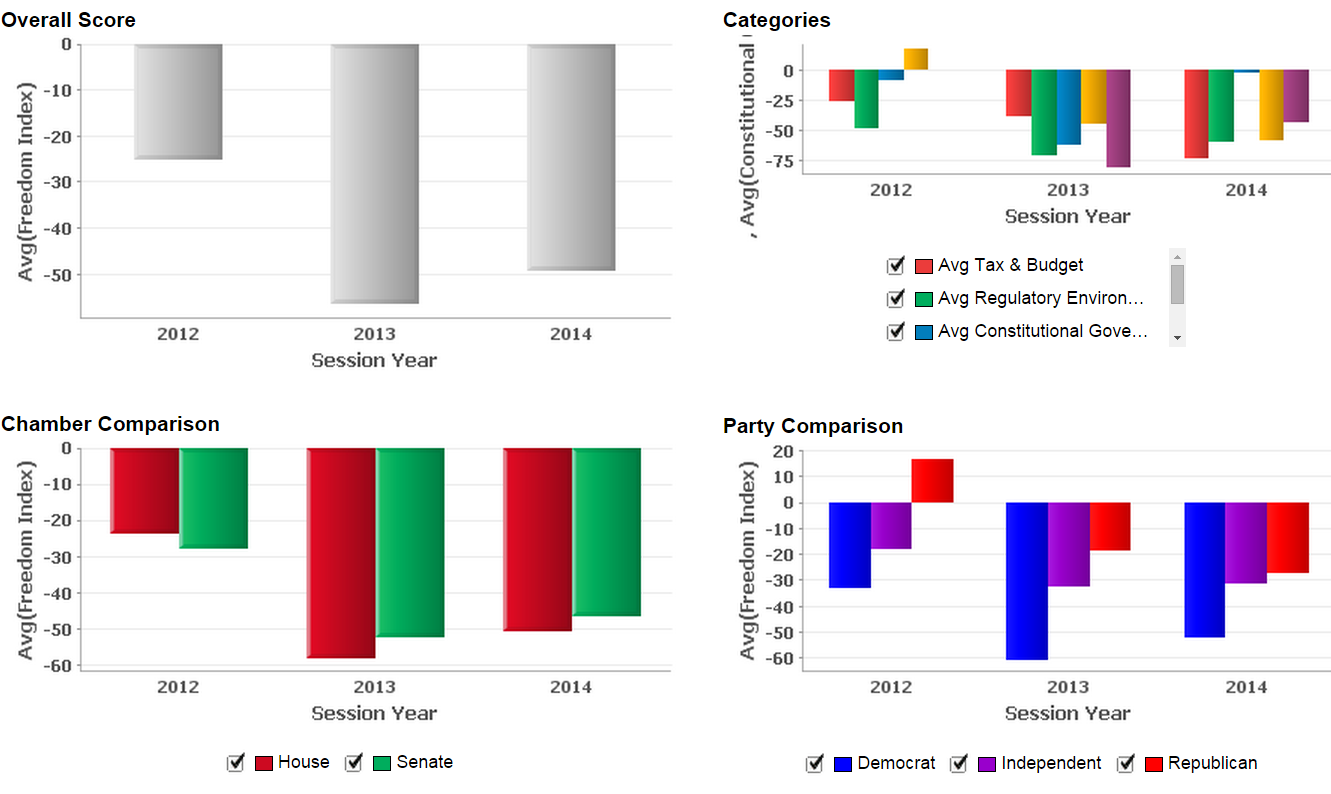
The average legislator index score of -49.4 indicates that the General Assembly moved Rhode Island in the wrong direction, and that Rhode Islanders are less free than they were in 2013. That result does represent a modest improvement from -56.6 the previous year. (The lowest possible score is -100.) However, it’s important to remember that it’s only an improvement in that the General Assembly is harming Rhode Island at a slightly slower rate. Actual improvement has yet to be made.
This index underscores our Center’s view that the RI General Assembly continues not to positively address the dire business climate of our state and that a Constitutional Convention may be the only way to move the Ocean State toward growth and an improved standard of living.
Other findings include:
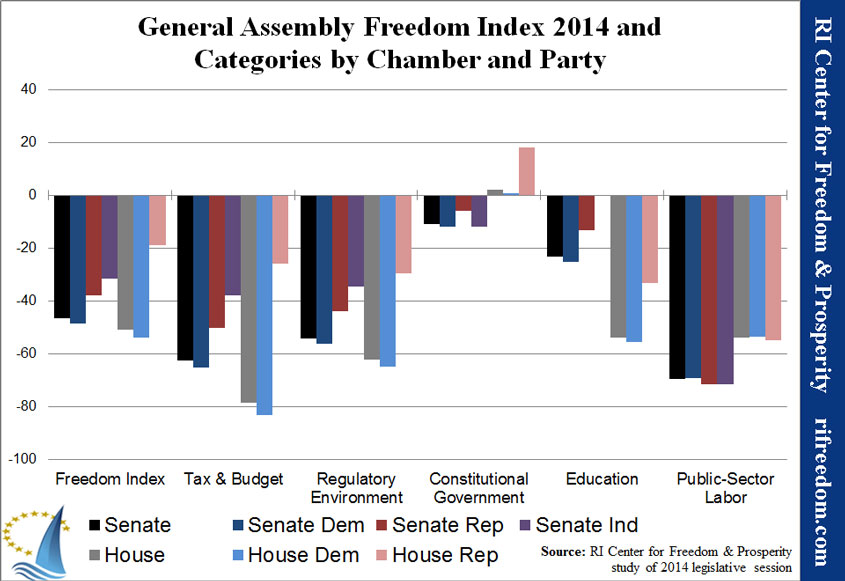
- Average House index of -51.0 (up from -58.6)
- Average Senate index of -46.7 (up from -52.4)
- Average House Democrat index of -53.8 (up from -63.1)
- Average House Republican index of -19.1 (down from -7.1)
- Average Senate Democrat index of -48.5 (up from -56.1)
- Average Senate Republican index of -38.0 (down from -33.2)
- Average Regulatory Environment index of -47.1 (up from -67.5)
- Average Tax & Budget index of -56.4 (down from -37.2)
- Average Constitutional Government index of -4.8 (up from -61.6)
- Average Public Sector Labor index of -69.5 (down from -44.0)
- Average Education Reform index of -23.1 (up from -86.4)
Freedom Index: Description and Methodology
Go to main Freedom Index page.
The index examines legislators’ votes in terms of their likely effect on the free market, the size and scope of government, the balance of residents’ interests against those of public employees and beneficiaries, and the constitutional structure of a divided government with limited power over the people whom it represents. The Center reviewed every bill that received a roll-call vote by the full membership of either chamber and selected 96 that fit its understanding of these criteria. (Companion bills only count once.)
The resulting scores give a detailed sense of each legislator’s priorities beyond a few high-profile issues.
The Center further divided the bills into five categories:
- Tax & budget: bills that affect the tax structure in Rhode Island and/or that relate to government expenditures, just driving or relieving the pressure on taxation
- Regulatory environment: bills that make it more or less difficult to live and do business in the state by imposing regulations
- Constitutional government: bills that affect the structure of the government, as well as the scope of government in its authority over residents’ lives
- Public sector labor: bills related to the relationship between its employees and itself and the electorate
- Education reform: bills that advance or impede the reform of the state’s public education system, in terms of both cost and quality
Most legislation has implications for more than one of these categories. For the purposes of this index, we applied our subjective sense of the area of core effect and sorted the bills accordingly. If, for example, a bill having to do with education seemed to us intended to secure the role of public employees, we classified that bill as Public Sector Labor, not Education Reform.
The Center selected legislative bills for inclusion in the Freedom Index if they were deemed to have an effect on free-market, small-government, or constitutional principles, with each bill assigned a positive or negative weighting based on the criteria listed below. Weighted points for each bill were given to each legislator based on his or her roll-call vote on it.
Each legislator’s final Freedom Index was calculated as his or her score’s percentage of the total possible points. A positive score indicates a voting record that generally protected individual and economic freedoms, while a negative score reflects the opposite.
Disclaimer: It should be noted that the total Freedom Index score generated for each legislator is a direct reflection of the perspective of the RI Center for Freedom & Prosperity when it comes to the weighting of each bill. The Freedom Index is not an absolute measure of a legislator’s merit and does not constitute any endorsement or individual criticism. The Freedom Index is a tool designed for general research and for accountability, giving voters some quantitative metrics for their own assessments as to their elected legislators’ performance.
Methodology
1) Determine weighting: Each selected bill received a weight ranging from +3 to -3, as determined by the RI Center for Freedom & Prosperity. Negative weights indicate legislation that creates or expands an agency, government program/function, or tax; creates new regulatory burdens; is hostile to constitutional principles; or otherwise conflicts with the principles that guide the Center. Positive factors were assigned to bills in line with those principles. Companion bills in the House and Senate were weighted identically. To determine the weightings, the Center requested reviews of all chosen legislation from a half dozen engaged Rhode Islanders with similar principles and combined the range of results for a final weighting.
2) Determine vote: Each legislator received a +1 or -1 vote factor, depending on whether he or she voted FOR or AGAINST a particular bill, respectively. If a legislator did not vote on a bill, he or she received a +0.25 if the bill passed or a -0.25 if the bill failed. Legislators who abstained from voting received a +0.75 or a -0.75 vote factor depending on if the bill passed or failed.
3) Calculate weighted vote: Multiplying the weighting factor and the vote factor produced a weighted vote score for each legislator for each bill.
4) Calculate the legislator score: The cumulative score for all bills for each legislator determined that legislator’s overall score.
5) Calculate Freedom Index: Dividing each legislator’s total score by the maximum possible for the appropriate chamber provided his or her Freedom Index, or a percentage of the best possible score he or she could have achieved. In 2014, the “perfect” scores are 99 for the House and 117 for the Senate.
For example, consider a bill that would increase the regulatory burden significantly in Rhode Island and that the Center therefore weighted as a -2. Legislator A voted for the bill. His or her weighted vote would be calculated as follows: -2 x 1 = -2. Conversely, the weighted vote for Legislator B, who voted against the bill, would be: -2 x -1 = 2.
If Legislator A, in the House chamber, earned a total legislator score of -33, his or her Freedom Index would be calculated as: -33 ÷ 143 x 100 = -23.1. If Legislator B in the Senate had a total score of +23, his or her Freedom Index would be calculated as: 23 ÷ 133 x 100 = 17.3.
To rank the legislators, the Center sorted them by their Freedom Index scores and then, in the cases of ties, by their scores in each category, in the following order: Regulatory Environment, Tax & Budget, Constitutional Government, Public Sector Labor, and Education Reform. When legislators’ results were still identical, the Center adjusted them in order of their apparent stature and power within their chambers.
Criteria
In determining each bill’s weighting, the following questions were considered:
- Does the bill create or eliminate an agency, program, or function of government?
- Does it give the government new or expanded power to prohibit or restrict activities in the free market? Examples may include licensure and other restrictions on legal business practices.
- Is it unconstitutional or does it do violence to our concepts of federalism or separation of powers? Does it restrict property, speech, gun, or other constitutionally recognized rights or freedoms? Conversely, does it restore balance between the state and federal government, resume state authority over an issue under the 10th Amendment, or remove restrictions on constitutionally protected rights?
Other considerations were also brought into question:
- Does the bill redistribute wealth or use tax policy or other incentives to reward specific interest groups with special favors or perks? Conversely, does it eliminate special favors and perks in the tax code or public policy?
- Does it perform a function that can and should be performed by the private sector or restore functions to the private sector?
- Does it grow or shrink the regulatory scope of an agency?
- Does it directly or indirectly create/reduce taxes, fees, or other assessments?
- Does it increase or decrease control of the private sector through rules, regulation, or statute?
- Does it increase or decrease long-term debt or override or restore statutory or constitutional protections against long-term debt?
- Does it give or reduce special benefits for government employees or politicians?
- Does it promote government transparency and openness or does it restrict access to information that should be in the public domain?
It should be noted that the complexity not only of the law but of political theory in general can make assessments of the sort described above subjective and very difficult. People reviewing the index should consider the results to be the best judgment of the Center, given our collected experience and expertise.
Each legislator received a +1 or -1 vote factor, depending on whether he or she voted FOR or AGAINST a particular bill, respectively. If a legislator did not vote on a bill, he or she received a +0.25 if the bill passed or a -0.25 if the bill failed. Legislators who abstained from voting received a +0.75 or a -0.75 vote factor depending on if the bill passed or failed.
2014 Legislative Scorecard
See how your Representative or Senator ranked in our 2014 General Assembly Freedom Index, as the state’s public policy continues to drift away from the principles of the free enterprise system.
[button url=”http://www.rifreedom.org/freedomindex” target=”_self” size=”medium” style=”royalblue” ] See legislator scores here [/button] [button url=”http://www.rifreedom.org/freedomindexlive” target=”_blank” size=”small” style=”skyblue” ] NOW LIVE! Interactive Scorecard [/button]Center Rates Fung Sales Tax Reduction Plan
October 14, 2014 – Providence, RI: The Rhode Island Center for Freedom & Prosperity released today a scoring-summary of the sales tax reduction plan offered by gubernatorial candidate, Allan Fung, who proposes to gradually reduce the state’s sales tax rate to 5.5% over the next four years from its current level of 7%.
According to the Center’s economic modeling program, RI-STAMP, the Fung plan would produce the following ‘dynamic’ results for the Ocean State job market and for state and municipal budgets. As compared with current baseline projections over the next four years …
A 6.25% sales tax rate in year-1 would produce 2043 new private sector jobs; would require $19.9 million in state budget savings; and would add almost $17 million statewide in new municipal revenues
A 6.00% sales tax rate in year-2 would produce 2663 new private sector jobs; would require $28.3 million in state budget savings; and would add almost $23 million statewide in new municipal revenues
A 5.75% sales tax rate in year-3 would produce 3250 new private sector jobs; would require $36.5 million in state budget savings; and would add over $29 million statewide in new municipal revenues
A 5.50% sales tax rate in year-4 would produce 3804 new private sector jobs; would require $46.3 million in state budget savings; and would add almost $36 million statewide in new municipal revenues
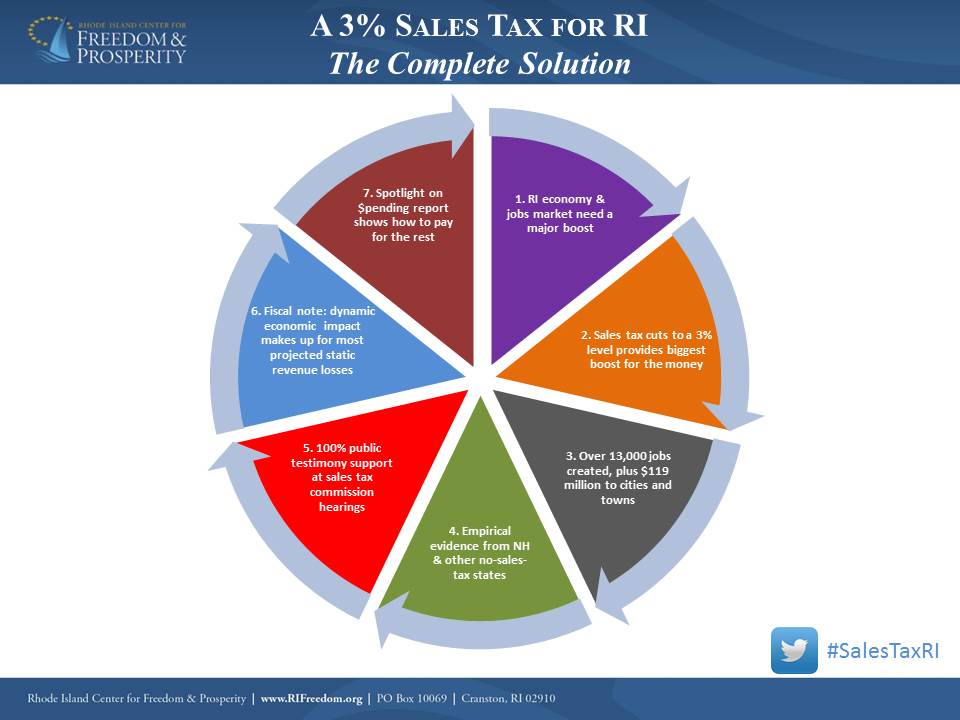 For years, the Center has been advocating for an immediate repeal of the sales tax, or a major reduction to 3%, as the most cost-effective way to produce tens of thousands of new jobs and to provide a major boost to Rhode Island’s stagnant economy. According to the Center’s RI-STAMP projections …
A 0.0% sales tax rate would produce 25,426 new private jobs; would require about $313 million in state budget savings; and would add about $150 million statewide in new municipal revenues.
A 3.0% sales tax rate would produce 13,424 new private jobs; would require about $47 million in state budget savings; and would add about $119 million statewide in new municipal revenues.
A detailed analysis of multiple sales tax reduction scenarios, with corresponding RI-STAMP projections, can be found here.
POLL: Why Rhode Islanders Want a Constitutional Convention
Read actual quotes from voters – very interesting
October 22, 2013, Warwick, RI – last evening at the RI Taxpayer Association meeting in Warwick, the RI Center for Freedom & Prosperity announced additional poll results from its September public opinion survey about likely-voter attitudes towards a Constitutional Convention, which will be decided on ballot Question-3 this November. The results show three-to-one support in to in favor of a convention and also show that arguments in support of a convention poll significantly stronger than arguments against a convention. Highlights of the recently released results, show that likely-voters:
- By a 63% – 21% margin, favor a convention
- By a 74% – 11% margin, see a convention as a means to bypass the traditional legislative process and have their independent voices heard
- By a 67% – 16% margin, favor tax and spending restraints (such as a line-item-veto and no more 38-Studios type bonds)
- By a 68% – 16% margin, believe that a convention would give voters a more direct say in their democracy
Previously released poll highlights can be seen below.
October 9, 2014; East Providence, RI – The Rhode Island Center for Freedom and Prosperity released figures from its recently commissioned poll at a lunch forum this afternoon at the Squantum Association in East Providence. Based on the results the Center recommends that voters “approve” RI ballot Question #3 to convene a Constitutional Convention.
At the forum, which featured nationally renowned anti-tax crusader, Grover Norquist, and former RI gubernatorial candidate, Ken Block, the Center released portions of a public opinion poll it commissioned last month.
The poll of over 500 likely voters was conducted by Communication Concepts of Easton, PA. It demonstrates the deep skepticism that Rhode Islanders feel towards their state government. In summary, Rhode Islanders believe …
The poll of over 500 likely voters was conducted by Communication Concepts of Easton, PA. It demonstrates the deep skepticism that Rhode Islanders feel towards their state government. In summary, Rhode Islanders believe …
- Overwhelmingly that RI is on the wrong track (70%-17%)
- Overwhelmingly that Economy/Jobs is the state’s most important problem (59%)
- Overwhelmingly that that our political leadership is not adequately addressing our state’s problems (77%-12%)
- Overwhelmingly that RI government is more geared towards special interest groups than towards the people (79%-11%)
“Voters are angry and are fed up with special interest politics,” observed Mike Stenhouse, CEO for the Center. “They see a Convention as a legitimate and needed avenue for their voices to be heard. With Rhode Islaners this obviously incensed and hungry for a solution, our Center recommends that voters approve Question-3 on the ballot in next month’s election.”
The Center also announced that it will launch a campaign to approve a Constitutional Convention. A white-board video ad, in response to the union sponsored “no” video, along with other digital ads can be viewed at RIFreedom.org/YesConCon.
[button url=”http://www.rifreedom.org/yesconcon/” target=”_blank” size=”medium” style=”royalblue” ] View Video and Digital Ads[/button]