Managing a Phase-In of Major Sales Tax Reform
The state budget is like a talisman that government officials and special interests raise to ward off the evil spirits of tax reform. Anything that promises not to raise taxes, or at least not to be “revenue neutral,” is said to be entirely unworkable — destined to eliminate every valued program of government. And when they’re really stuck, budget protectionists will claim that even a reform that they ought to support for every economic and humanitarian reason is impossible because the budget couldn’t absorb the shock of the first year. The withdrawals of revenue dependency might kill the junkie.
When it comes to dropping Rhode Island’s state sales tax to 3%, as RI House bill 8039 and Senate bill 2919 would do, the problem is not so dramatic. To begin with, the companion bills would implement the change at the beginning of 2015, which maintains the higher tax rate through the summer tourist season and the holiday shopping season. (The latter period on the calendar might also help to reduce the likelihood that people would hold off on purchases in the months leading up to the tax reduction, while also producing a boost during a slower time of the year.)
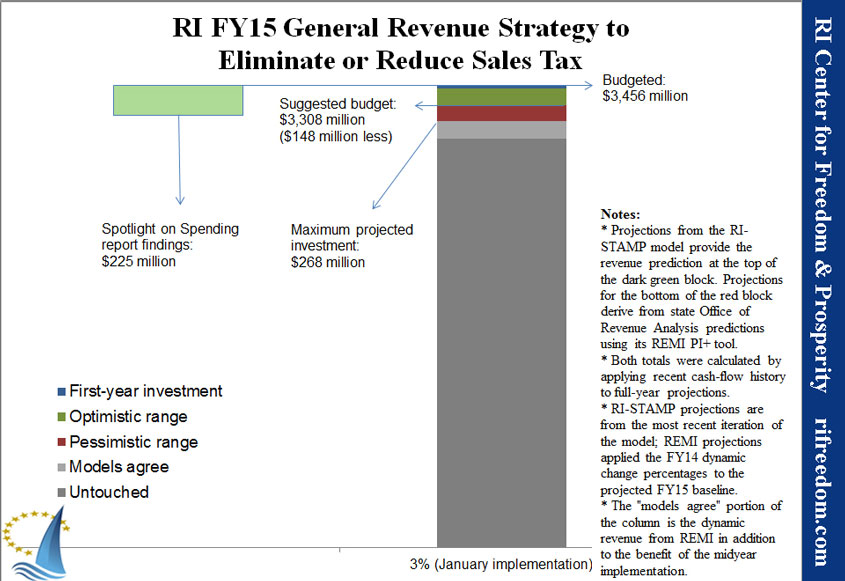
The following chart, part of the RI Center for Freedom & Prosperity’s “complete solution,” shows the RI Center for Freedom & Prosperity’s suggested approach to managing the implementation of this unprecedented tax reform, taking advantage of the state government’s access to two respected economic modeling tools: the RI-STAMP model used by the Center and the REMI PI+ model used by the state’s Office of Revenue Analysis.
The total height of the column is the governor’s recommended general fund (state) revenue for the next fiscal year.
- The dark gray block at the bottom is the $3.054 billion that would be under no risk at all, even if the state dropped its sales tax rate from 7% to 3% for the entire year and the reform had no dynamic effect increasing tax revenue somewhat by improving the economy.
- The silver block is the $134.25 million that the state secures by starting the reform halfway through the fiscal year plus the dynamic revenue that the REMI PI+ model projects for the reform. (For a variety of reasons, the Center believes these results to be overly pessimistic. One very substantial reason is that the Office of Revenue Analysis assumed across-the-board cuts to make up for the reduced revenue, which bit into areas of spending that, they claim, have a strong benefit for the local economy and, therefore, the dynamic effects of the reform.)
- The red block shows the portion of the revenue for which the state should have some plans to reduce spending if REMI’s pessimism turns out not to have been unreasonable. The top of this block is the budget that the Center recommends that the General Assembly actually pass.
- The green block represents the added revenue that RI-STAMP projects the state will realize above the Center’s recommended budget. If legislators wish to minimize the effects of the reform, they can plan for spending and program increases that would go into effect as this revenue actually comes in.
- The sliver of blue at the top of the column is the $28.9 million that the Center expects the state to have to trim from the governor’s recommended budget as an investment in the 3% sales tax reform.
The light-green block to the left represents the $224.5 million in savings that the Center’s Spotlight on Spending report identified in the governor’s proposed budget (spanning both his suggested revision for FY14 and spending for FY15). As the chart shows, these potential savings cover all but the most pessimistic $43 million at the bottom of the red block.
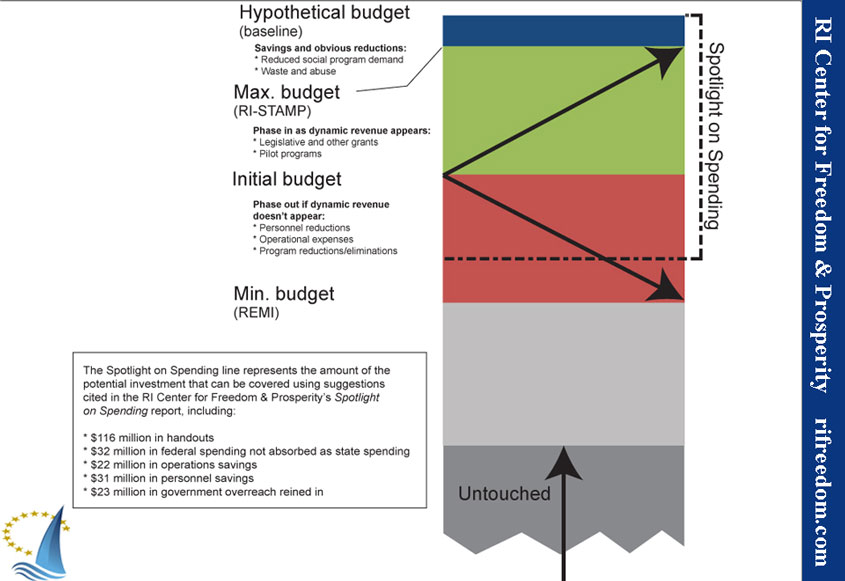
The next chart zooms in on the upper part of the column, with some explanation. Basically, the strategy calls for the state to pass an initial budget (of $3.3 billion in general revenue spending) and then follow the monthly cash flow reports from the Office of Revenue Analysis. If the dynamic effects of the more optimistic RI-STAMP model are proving to be the case, nice-to-have spending like grants and pilot programs can be phased in. If the pessimism of the REMI model is proving to be the case, reductions of a more fundamental (but still non-essential) nature can be phased in.
Click here for a PDF of these two charts and the full table of Spotlight on Spending recommendations.


Leave a Reply
Want to join the discussion?Feel free to contribute!