RI General Assembly 2013 Session Freedom Index

Download: Freedom Index 2013 Scorecard;   legislator votes, bill explanations, and rankings 

The second-annual General Assembly Freedom Index by the RI Center for Freedom & Prosperity scores Ocean State lawmakers on their level of support for principles of freedom as proven by their votes on the floors of the House and Senate. In response to IRS proposals that would limit the activities of non-profit groups like our Center, the Center released its initial version with legislators names redacted, identifying them only by chamber, party, and district (Read related commentary here). The full, non-redacted version is now released.

The index examines legislators’ votes in terms of their likely effect on the free market, the size and scope of government, the balance of residents’ interests against those of public employees and beneficiaries, and the constitutional structure of a divided government with limited power over the people whom it represents. The Center reviewed every bill that received a roll-call vote by the full membership of either chamber and selected 96 that fit its understanding of these criteria. (Companion bills only count once.)

The resulting scores give a detailed sense of each legislator’s priorities beyond a few high-profile issues.

The Center further divided the bills into five categories:

  • Tax & budget:  bills that affect the tax structure in Rhode Island and/or that relate to government expenditures, just driving or relieving the pressure on taxation
  • Regulatory environment: bills that make it more or less difficult to live and do business in the state by imposing regulations
  • Constitutional government: bills that affect the structure of the government, as well as the scope of government in its authority over residents’ lives
  • Public sector labor: bills related to the relationship between its employees and itself and the electorate
  • Education reform: bills that advance or impede the reform of the state’s public education system, in terms of both cost and quality

Most legislation has implications for more than one of these categories.  For the purposes of this index, we applied our subjective sense of the area of core effect and sorted the bills accordingly.  If, for example, a bill having to do with education seemed to us intended to secure the role of public employees, we classified that bill as Public Sector Labor, not Education Reform.

Download: Freedom Index 2013 Scorecard; legislator votes, bill explanations, and rankings 

2013 Freedom Index Findings

One hundred and sixteen (116) different pieces of legislation (counting companion bills once) were evaluated.  The Center judged 93 of them as having a negative effect on freedom.

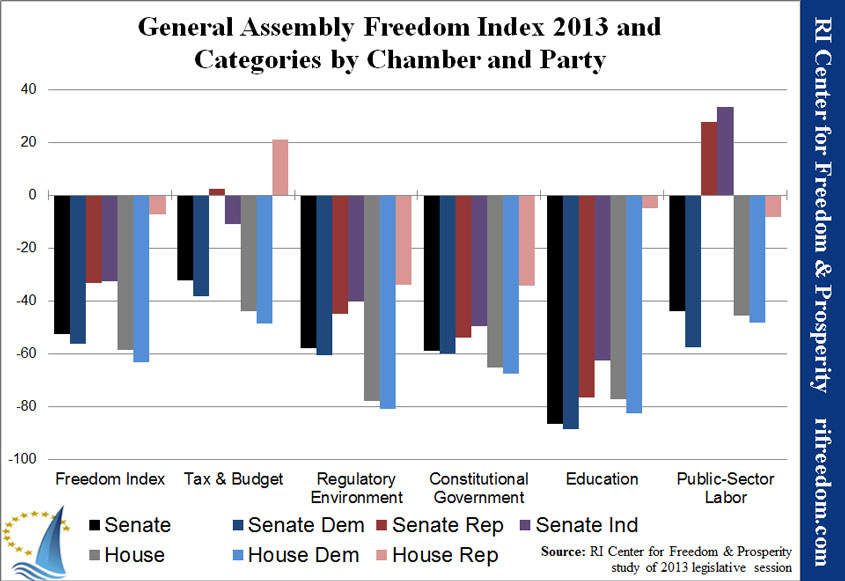
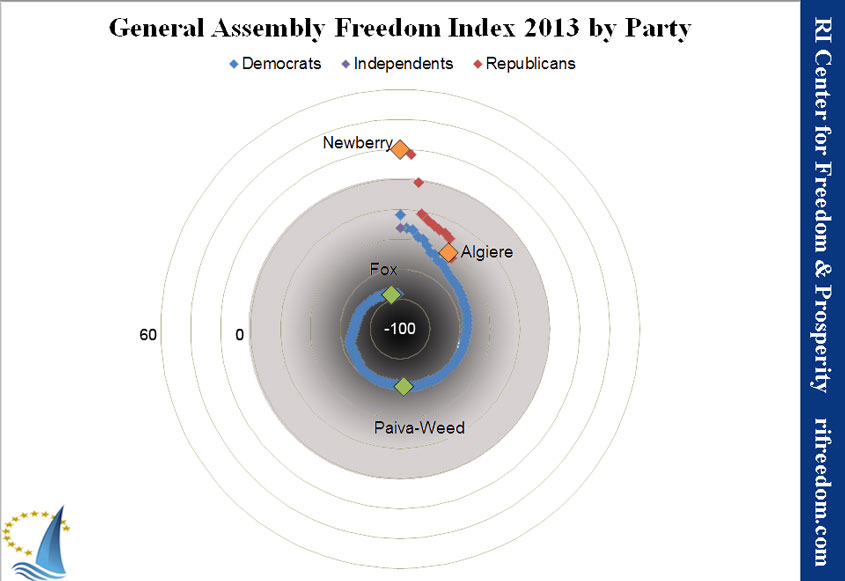
The average legislator index score of -56.6 indicates that the General Assembly moved Rhode Island in the wrong direction, and that Rhode Islanders are less free than they were in 2012. What’s more, that result is down from -25.4 the previous year.  (The lowest possible score is -100.)  In other words, legislators aren’t even trending in the direction of the right direction. This index underscores our Center’s view that the RI General Assembly continues not to positively address the dire business climate of our state.

freedom-index-spiral-2013-web

Other findings include;

  • Average House index of -58.6 (down from -24.1)
  • Average Senate index of -52.4 (down from -27.9)
  • Average House Democrat index of -63.1 (down from -32.2)
  • Average House Republican index of -7.1 (down from 28.8)
  • Average Senate Democrat index of -56.1 (down from -36.3)
  • Average Senate Republican index of -33.2 (down from 1)
  • Average Regulatory Environment index of -67.5 (down from -49.0)
  • Average Tax & Budget index of -37.2 (down from -26.0)
  • Average Constitutional Government index of -61.6 (down from -9.1)
  • Average Public Sector Labor index of -44.0 (down from 16.7)
  • Average Education Reform index of -86.4 (there were no bills in this category last year)

ricfp-freedomindexandcategories2013-web


Index Overview

The Center selected legislative bills for inclusion in the Freedom Index if they were deemed to have an effect on free-market, small-government, or constitutional principles, with each bill assigned a positive or negative weighting based on the criteria listed below. Weighted points for each bill were given to each legislator based on his or her roll-call vote on it.

Each legislator’s final Freedom Index was calculated as his or her score’s percentage of the total possible points. A positive score indicates a 2013 voting record that generally protected individual and economic freedoms, while a negative score reflects the opposite.

Disclaimer: It should be noted that the total Freedom Index score generated for each legislator is a direct reflection of the perspective of the RI Center for Freedom & Prosperity when it comes to the weighting of each bill. The Freedom Index is not an absolute measure of a legislator’s merit and does not constitute any endorsement or individual criticism. The Freedom Index is a tool designed for general research and for accountability, giving voters some quantitative metrics for their own assessments as to their elected legislators’ performance. 

Methodology

1) Determine weighting: Each selected bill received a weight ranging from +3 to -3, as determined by the RI Center for Freedom & Prosperity. Negative weights indicate legislation that creates or expands an agency, government program/function, or tax; creates new regulatory burdens; is hostile to constitutional principles; or otherwise conflicts with the principles that guide the Center. Positive factors were assigned to bills in line with those principles. Companion bills in the House and Senate were weighted identically. To determine the weightings, the Center requested reviews of all chosen legislation from a half dozen engaged Rhode Islanders with similar principles and combined the range of results for a final weighting.

2) Determine vote: Each legislator received a +1 or -1 vote factor, depending on whether he or she voted FOR or AGAINST a particular bill, respectively. If a legislator did not vote on a bill, he or she received a +0.25 if the bill passed or a -0.25 if the bill failed. Legislators who abstained from voting received a +0.75 or a -0.75 vote factor depending on if the bill passed or failed.

3) Calculate weighted vote: Multiplying the weighting factor and the vote factor produced a weighted vote score for each legislator for each bill.

4) Calculate the legislator score:  The cumulative score for all bills for each legislator determined that legislator’s overall score.

5) Calculate Freedom Index: Dividing each legislator’s total score by the maximum possible for the appropriate chamber provided his or her Freedom Index, or a percentage of the best possible score he or she could have achieved. In 2012, the “perfect” scores are 143 for the House and 133 for the Senate.

For example, consider a bill that would increase the regulatory burden significantly in Rhode Island and that the Center therefore weighted as a -2. Legislator A voted for the bill. His or her weighted vote would be calculated as follows: -2 x 1 = -2. Conversely, the weighted vote for Legislator B, who voted against the bill, would be: -2 x -1 = 2.

If Legislator A, in the House chamber, earned a total legislator score of -33, his or her Freedom Index would be calculated as: -33 ÷ 143 x 100 =  -23.1.  If Legislator B in the Senate had a total score of +23, his or her Freedom Index would be calculated as: 23 ÷ 133 x 100 = 17.3.

To rank the legislators, the Center sorted them by their Freedom Index scores and then, in the cases of ties, by their scores in each category, in the following order: Regulatory Environment, Tax & Budget, Constitutional Government, Public Sector Labor, and Education Reform. When legislators’ results were still identical, the Center adjusted them in order of their apparent stature and power within their chambers.

Criteria

In determining each bill’s weighting, the following questions were considered:

  • Does the bill create or eliminate an agency, program, or function of government?
  • Does it give the government new or expanded power to prohibit or restrict activities in the free market? Examples may include licensure and other restrictions on legal business practices.
  • Is it unconstitutional or does it do violence to our concepts of federalism or separation of powers? Does it restrict property, speech, gun, or other constitutionally recognized rights or freedoms? Conversely, does it restore balance between the state and federal government, resume state authority over an issue under the 10th Amendment, or remove restrictions on constitutionally protected rights?

Other considerations were also brought into question:

  • Does the bill redistribute wealth or use tax policy or other incentives to reward specific interest groups with special favors or perks? Conversely, does it eliminate special favors and perks in the tax code or public policy?
  • Does it perform a function that can and should be performed by the private sector or restore functions to the private sector?
  • Does it grow or shrink the regulatory scope of an agency?
  • Does it directly or indirectly create/reduce taxes, fees, or other assessments?
  • Does it increase or decrease control of the private sector through rules, regulation, or statute?
  • Does it increase or decrease long-term debt or override or restore statutory or constitutional protections against long-term debt?
  • Does it give or reduce special benefits for government employees or politicians?
  • Does it promote government transparency and openness or does it restrict access to information that should be in the public domain?

It should be noted that the complexity not only of the law but of political theory in general can make assessments of the sort described above subjective and very difficult. People reviewing the index should consider the results to be the best judgment of the Center, given our collected experience and expertise.

Download: Freedom Index 2013 Scorecard; legislator votes, bill explanations, and rankings 

Each legislator received a +1 or -1 vote factor, depending on whether he or she voted FOR or AGAINST a particular bill, respectively. If a legislator did not vote on a bill, he or she received a +0.25 if the bill passed or a -0.25 if the bill failed. Legislators who abstained from voting received a +0.75 or a -0.75 vote factor depending on if the bill passed or failed.
Commentary: Redacted Legislator Names as IRS Protest

NOTE FROM THE CEO

Our Center created its annual Freedom Index and legislator scorecard in Rhode Island as a means of informing citizens which legislators have voted to protect our freedoms and which have voted to further encroach upon our liberties. Perhaps no freedom is more sacred to Americans than the right to free speech. However, a coordinated national attack has been mounted that would limit our Constitutional right to openly and rigorously debate public policy and to hold accountable elected officials and candidates. Within the past year, the IRS proposed new regulations that would greatly restrict the ability of 501(c)(4) advocacy organizations to conduct such activity, regulations that threaten also to undercut the work of 501(c)(3) research organizations such as the RI Center for Freedom & Prosperity.

The Freedom Index is intended as a tool to educate the people of Rhode Island about the activities of their government. However, under many circumstances, the proposed IRS regulations would redefine the publishing of legislator names on any kind of scorecard — such as our Freedom Index — as “political activity.”

As a symbol of protest against these draconian proposals to restrict the freedom of grassroots advocacy groups to engage in related analysis, our Center will initially publish its Freedom Index for the 2013 RI General Assembly session with the names of legislators redacted. We had already based the index on a reading of legislation without regard to how individual legislators voted. By redacting legislators names, we are taking the additional step of associating the results only with the electoral districts in whose names the actions are taken.

If the IRS does not want grassroots groups to call out legislators by name, then our Center — as our form of protest — will not name them – at least for the moment.

“A properly functioning democracy depends on an informed electorate,” said Thomas Jefferson. We agree, and our Center decries this attempt by the IRS to limit free speech, to shut down public debate, and to inhibit the vital process of providing educational information to the citizenry.

Mike Stenhouse

2013 General Assembly Freedom Index

How did your legislator perform last year?

Did they enhance or encroach upon your freedoms?

ONLY 2 of 113 LEGISLATORS EARN A POSITIVE SCORE!

 2013 Legislative Scorecard

Watch the Great Ocean State Debate

The debate was held on Saturday, April 26 on the University of Rhode Island campus.

NOW ON CABLE TV

You can watch the first 1-hour segment of the debate on State of the State cable TV

Part 1: The Economics of Tax Policies

Panelists: Samuel Bell; Justin Braga; Stephen Moore; and Tom Sgouros

Moderator:  Josh Fenton       Host: Mike Stenhouse, Center for Freedom & Prosperity    

Time: 60 minutes The Unleash R.I. Debate Series was produced by The Center for Freedom and Prosperity on April 26, 2014. What’s Really in Our Best Interest? is the first of the debate series. This is Debate Segment #1: The Economics of Tax Policies, which includes (A) Policy Philosophy & Impact in the Ocean State, (B) Specific Policy Ideas for Rhode Island.

Broadcast dates, times and channels

Saturday, May 10 at 11:00 PM on Cox channel 13, Verizon channel 32, and Full Channel 9

Sunday, May 11 at 8:00 AM on Cox channel 13, Verizon channel 32, and Full Channel 9

Monday, May 12 at 9:00 PM on Cox channel 18, Verizon channel 31, and Full Channel 9

Thursday, May 15 at 9:00 PM on Cox channel 18, Verizon channel 31, and Full Channel 9

Note: Cox channel 18 and Verizon 31 are local broadcast in Kent County only, which includesCoventry; East Greenwich; Exeter; North Kingstown; Warwick; West Warwick; and West Greenwich.

ONLINE ARCHIVED VERSION

An online archive of the entire debate will soon be available for viewing, please check back soon. If you have not already done so, we kindly request that you register and take a short survey, by clicking the button below, prior to viewing the video:

[button url=”http://events.constantcontact.com/register/event?llr=pjb6jgcab&oeidk=a07e99dney25351de42″ target=”_blank” size=”medium” style=”royal blue” ]Register Here[/button]

In the meantime, here’s a brief video overview of the debate …


View archived video of the great Ocean State Debate

Check back soon to watch this ONE-OF-A-KIND DEBATE on the web with some of the nation’s leading policy experts!

Are we better off with more or less government in our lives? Are some public policies ‘immoral’?

[button url=”http://www.rifreedom.org/?p=10741″ target=”_self” size=”medium” style=”black” ]Watch on Cable-TV or Online[/button]

Rhode Island Employment Snapshot, March 2014: A Boom Without Tremors

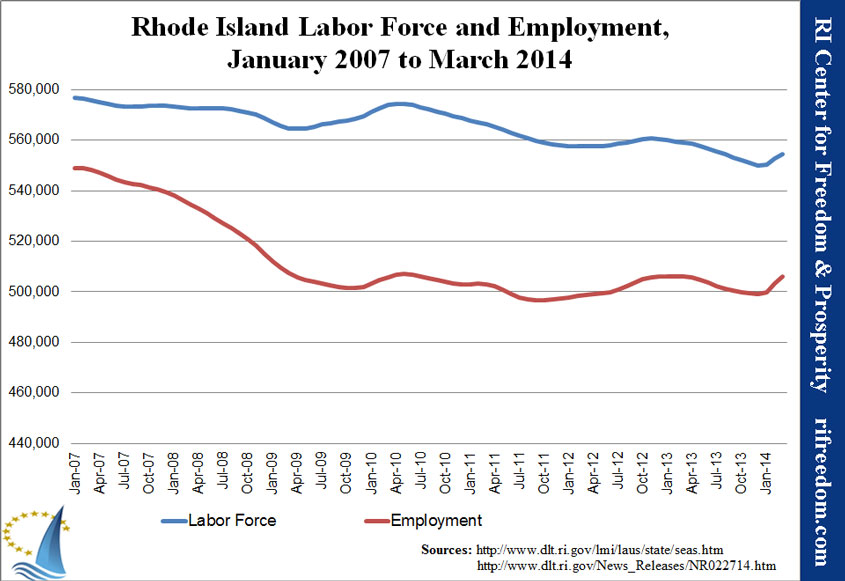
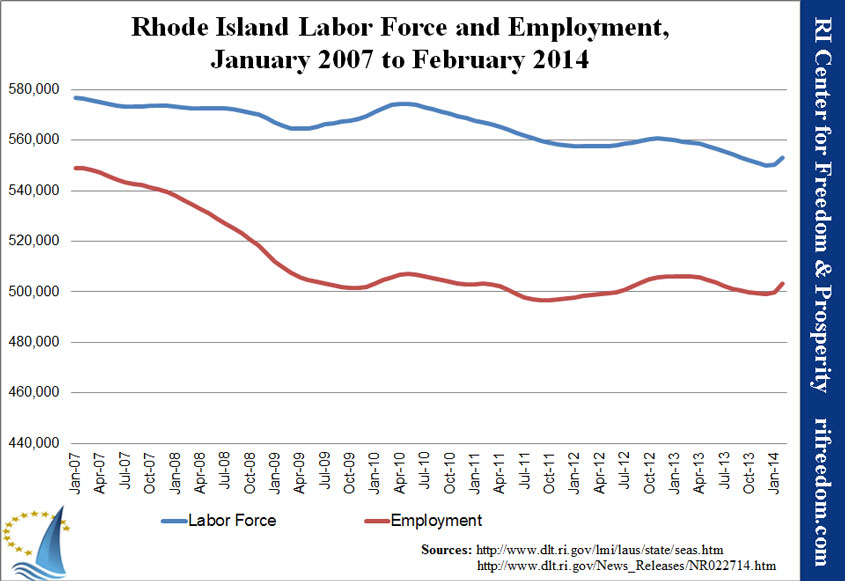
The headline for Rhode Island’s employment picture for March is that the unemployment rate slid all the way down to 8.7% (still last in the nation, though).  You’d be hard pressed to find evidence of this employment boom in the experience of living here, but there it is.

The first chart below illustrates why some healthy skepticism continues to be in order. After many years of general stagnation, February and March 2014 arrive as a sudden ramp, both in employment and in labor force.

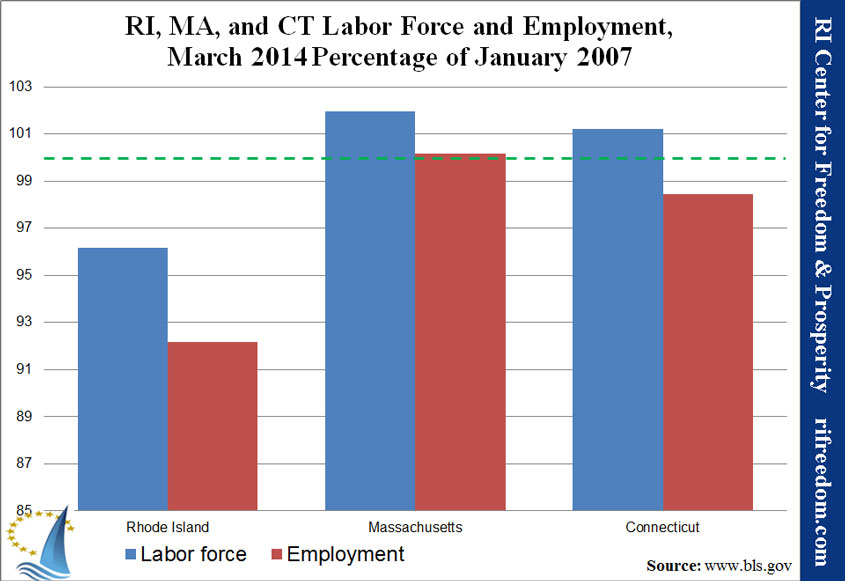
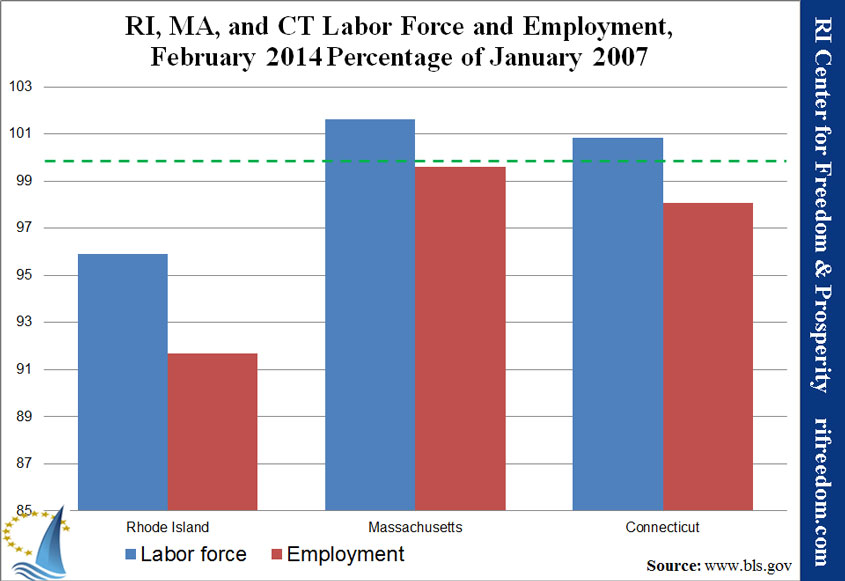
The second chart provides a longer-term sense of the results. Rhode Island is still below its employment level just before the jobs-crash of the recession and still lags both of its neighbors dramatically when it comes to reclaiming jobs.  Indeed, Massachusetts is now beyond where it was in January 2007, and almost at its pre-recession peak, which it hit a few months later.

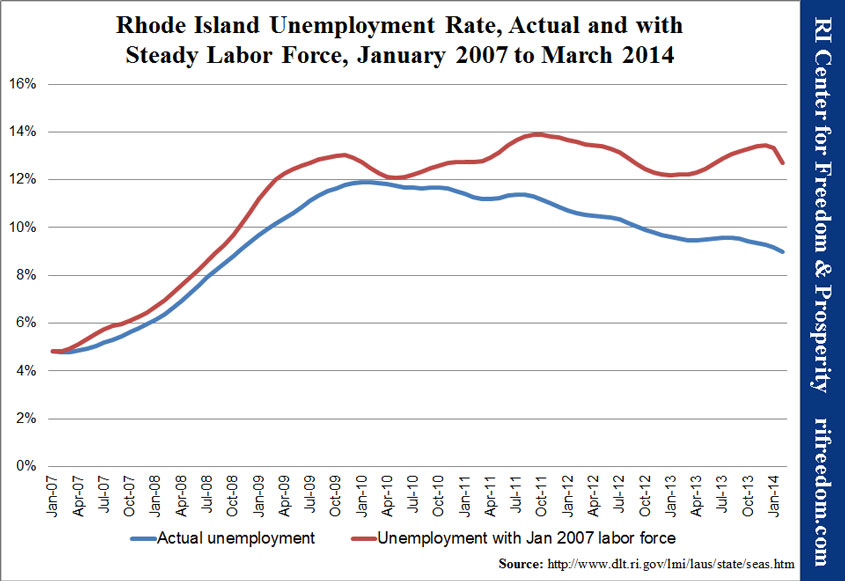
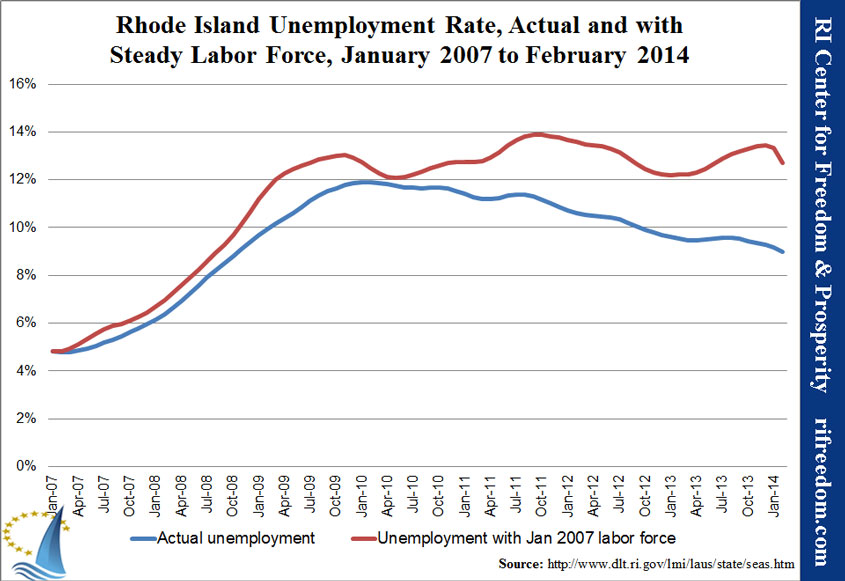
The third chart compares Rhode Island’s unemployment rate with what it would have been if the state’s labor force had held steady. It shows that unemployment never got as low as Rhode Island officials had claimed, and the growth in the gap between the two lines is steadier and more dramatic, with the exception of the peculiar results these past two months.

The chart makes clear that the Ocean State’s unemployment rate would have been much higher, over the past few years, had people not given up looking for work… almost reaching 14% in 2011. It also emphasizes the disturbing trend that the only reason the unemployment rate seems to have been stagnant, rather than increasing, throughout 2013 is that fewer Rhode Islanders are counted at all.

RI-laborforceandemp-0107-0314RIMACT-laborforceandemp-0314perc0107RI-unemploymentrate-steadyLF-0107-0314

The Great Ocean State Debate – Registration Now Open

ATTEND THIS ONE-OF-A-KIND DEBATE on April 26 @ URI with some of the nation’s leading policy experts!

Are we better off with more or less government in our lives? Are some public policies ‘immoral’?

[button url=”https://www.youtube.com/watch?v=LIhO0qo8w34&feature=youtu.be” target=”_self” size=”medium” style=”orange” ]See VIDEO promo[/button] [button url=”http://www.rifreedom.org/debate/” target=”_self” size=”medium” style=”royalblue” ]FREE Registration Here[/button]

PolitiFact Should Fact-Check Itself in Bogus Ruling

Update: PolitiFact acknowledges that the major elements of my statement were indeed true, before RULING that the statement was “Mostly False”. Read their twisted logic here … 

Read the full story – what the PolitiFact article did not tell you – below.

Commentary, April 4, 2014

Earlier this week our Center published its Spotlight On Spending report. That same day the Providence Journal published a related OpEd piece that I co-authored along with David Williams of the Taxpayers Protection Alliance, which partnered with the Center in creating and publishing the report.

PolitiFact, the Journal’s fact-checking unit, noticed a slight discrepancy in the description of a the same item that was referred in both my opinion piece and in the report. PolitiFact believes this semantic discrepancy is of significant enough public value to warrant an investigation; I do not. It completely misses the material reason why this item was included our report.

As it turns out, it was PolitiFact that made a significant error in mis-characterizing my original statement. See below for the explanation.

Sometime next week, PolitiFact will rule on the truth-fullness of my statement in the OpEd. Our Center believes in government transparency and applies that belief to our exchange with PolitiFact. It is important that interested readers know the whole story.

Questions and Clarifications Posed by PolitiFact’s Gene Emery

THREE SEPARATE EMAILS:

1) Hi Mike,I want to fact-check the statement in your commentary, “A grant for $5,000 went to teach an employee at a company that makes ornamental business card holders how to use Facebook and Twitter.” That seems to be referencing the part of the report that talks about “$5,000 to provide social media training for employees at Ahler’s Designs.” So it is one employee or several employees? And did the $5,000 just for teaching someone to use Facebook and Twitter, or was there more involved? If you could point me to your sources, that would useful. Thanks, — Gene Emery

2) That factoid was featured in your Journal commentary. Not only was it repeated in the Journal story the next day, it was played up prominently by Channel 10 and GoLocalProv.I asked you about it because you are the lead author of the commentary, and paying $5,000 to teach one person how to sign up for Facebook and Twitter, which millions have figured out for themselves, seems pretty outrageous. However the report, and the footnoted document, seems to tell a slightly different story: more than one employee and broader training in social media. Actually, according to the reference document in your own report, it’s 3 employees trained at $2,500 and 1 student trained at the same price. So is the report in error, did you misstate the facts in your commentary, or is your commentary referencing something else? –Gene
.
3) In the interim, I spoke to the company. They say 3 employees and 2 students received 32 hours of training over eight weeks, making the argument that it’s important for today’s businesses to know the ins and outs of social media, and being a business using social media involves a lot more than setting up a personal Facebook account. I mention this because you might want to react to that argument. — Gene
.

Full Response by Mike Stenhouse

We agree with PolitiFact that taxpayer dollars being spent on something that millions have figured out for themselves is outrageous. We question, however, the public service value of fact-checking the semantic difference between “an employee” and “employees’ when a much larger public policy question is at the core of the issue.

There was no mistake in either statement. However there was a mistake in PolitiFact’s characterization of my commentary piece in an email that asked me to respond to the alleged statement –  “‘$5,000 to teach one person how to sign up for Facebook and Twitter’, which millions have figured out for themselves, seems pretty outrageous.” In my commentary, I never made that statement; I never used the term ‘sign-up’, but instead used ‘how to use’; nor did I say ‘one person’; I said ‘an employee’. For a fact-checking organization to call a statement I never made “outrageous”, is outrageous in and of itself.

Both statements accurately identify the same material finding: that $5000 in taxpayer money went to a private company for social media training.[http://www.gwb.ri.gov/pdfs/FY13ExpressGrantAwards.pdf]

The more superfluous descriptions of how that funding was used vary only in that the statement from the OpEd describes a subset of the broader and more inclusive statement from the report.

  • It is true that “an employee” received training, even if others received training as well

  • It is true that the Ahler’s Designs makes business card holders

  • It is presumably true that Facebook and Twitter were part of the larger social media training

The reason we included this item in our report, is not because of the amount of money spent per employee, as PolitiFact appears to be concerned with, but rather that any taxpayer dollars were spent in this regard in the first place. This spending was outrageous, regardless of whether or not the business owner feels that it was important for her business.

Either way, this scenario where many companies pay into a fund that gets re-distributed to just a few, is itself unfair, while also creating potential for cronyism and insider politics. In fact, an additional GWB post notes that in 2013, this same company, “Ahlers Design received $8,150 to train three employees; it also received $8,150 in youth bonus funding.” [http://www.rihric.com/news/news062013.htm] .

The lack of transparency and specificity in the GWB’s reporting apparently also has confused someone at Ahler’s or at GWB. The referenced source in our report indicates that four employees received training; yet Ahler’s stated to PolitiFact that five employees received training. Will this discrepancy be PolitiFact checked? Is this even an important distinction? Like the original premise of this PolitiFact investigation … I think not.

Rhode Island Employment Snapshot, February 2014: Still Last

Rhode Island’s employment picture for February gives a positive impression, on first look. Put in the contexts of the past and of the country, however, it’s not quite as sunny.

On the first count, the numbers show a boom in employment, out of nowhere. We’ve seen such results every year for the past several, and they’ve always been followed by significant downward revisions.

On the second count, although Rhode Island was second strongest (after Virginia), the significant increase occurred almost universally across the country — both in states that had been experiencing growth and in states (like Rhode Island) that had been on the downswing.

The first chart below illustrates why a healthy skepticism is in order. After many years of general stagnation, February 2014 arrives as a sudden ramp, both in employment and in labor force.

The second chart provides a longer-term sense of the results. Rhode Island is still below its employment level just before the jobs-crash of the recession and still lags both of its neighbors dramatically when it comes to reclaiming jobs.

The third chart compares Rhode Island’s unemployment rate with what it would have been if the state’s labor force had held steady. It shows that unemployment never got as low as Rhode Island officials had claimed, and the growth in the gap between the two lines is steadier and more dramatic, with the exception of the peculiar results this past month.

The chart makes clear that the Ocean State’s unemployment rate would have been much higher, over the past few years, had people not given up looking for work… almost reaching 14% in 2011. It also emphasizes the disturbing trend that the only reason the unemployment rate seems to have been stagnant, rather than increasing, throughout 2013 is that fewer Rhode Islanders are counted at all.

RI-laborforceandemp-0107-0214

RIMACT-laborforceandemp-0214perc0107

RI-unemploymentrate-steadyLF-0107-0214