Pensions Beyond Pay
Among the more detailed features of the RIOpenGov.org pension page is the comparison of pensions against final average salaries. A push of the button on the “detailed search” tab shows there to be 3,298 pensioners whose retirements are paying better than their jobs ever did.
These retirees are collecting $20,903,314 more from the state than they did in the final years of their careers. On average, they have been retired for 18 years and still have an estimated 13 years to go — having retired at 56. For all retirees, the corresponding averages are 13 years retired, with 15 to go, having retired at 58.
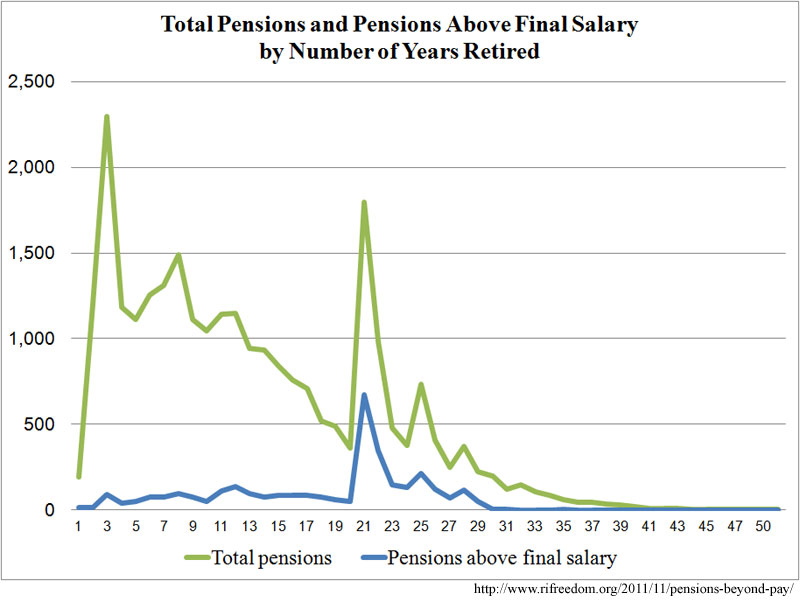
Interestingly, the number of pensions above pay does not match up with the number of years retired as well as one would expect. Apart from a huge burst of retirements in the early ’90s, the trend line for total retirements isn’t surprising; the farther from retirement pensioners get, the fewer of them there are:
Viewing pensions that exceed pay as a percentage of total pensions, however, yields a more unexpected result:
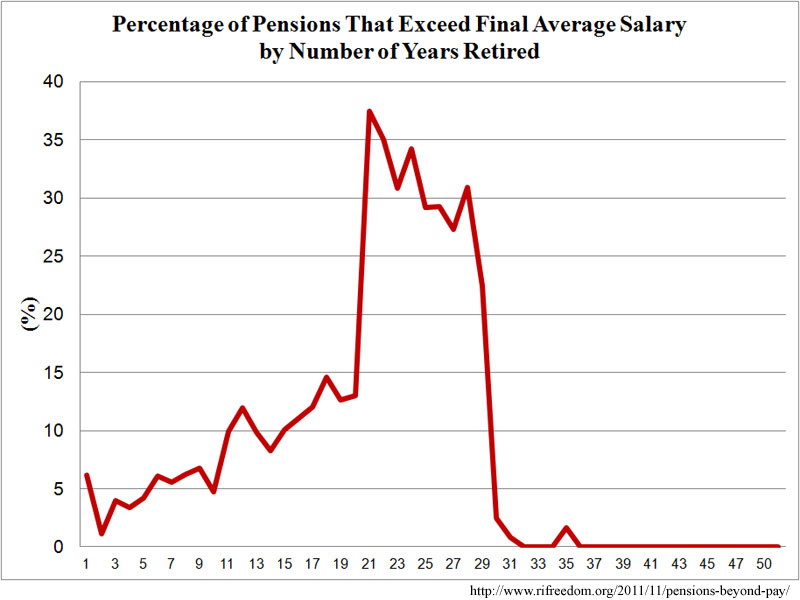
As a matter of simple arithmetic, it would make more sense for the percentage to continue to grow as the years go up, thanks to cost of living adjustments (COLAs). That the result does not match expectations merits further investigation, but for the time being, suffice it to say that such peculiarities give some credence to suggestions that pension deals of the past were inordinately generous and should be pulled back.
Among retired public-sector workers whose pensions exceed their working salaries, the average pension is $45,815 per year, which is $6,338 more than the average final salary. For the pension system overall, the average is $31,388, which is $12,021 less than the average final salary.
At this point, it makes sense to look at differences in the results based on the retirees’ former employers, and clearly, not all pension-granting public entities are equal. Of the 184 public employers, 81 have retirees who have surpassed their salaries. For 43 of the employers, more than 10% of all retirees are in this group.
|
% of Retirees Exceeding Salaries
|
Overall # of Pensions
|
Overall Average Pension ($)
|
|
| Foster School Dist. |
47
|
19
|
40,962
|
| Burrillville Police Dept. |
33
|
9
|
28,660
|
| Northern Rhode Island Collaborative (NC) |
33
|
6
|
16,222
|
| Barrington Public Schools |
28
|
202
|
42,651
|
| Warwick School Dept. |
26
|
980
|
44,598
|
| North Providence Hsg. Auth. |
25
|
4
|
22,592
|
| Cumberland School Dept. |
22
|
334
|
43,614
|
| Middletown Public Schools |
22
|
242
|
42,334
|
| Newport School Dept. |
21
|
363
|
41,593
|
| Johnston School Dept. |
21
|
215
|
43,505
|
| Coventry Public Schools |
21
|
325
|
47,098
|
| Cranston School Dept. |
20
|
769
|
44,425
|
| Lincoln School Dept. |
19
|
193
|
45,148
|
| Providence School Dept. |
19
|
1361
|
41,604
|
| North Smithfield School Dept. |
19
|
116
|
41,529
|
| Pawtucket School Dept. |
19
|
632
|
43,330
|
| Tiverton School Dept. |
18
|
161
|
41,322
|
| East Providence Schools |
17
|
479
|
45,030
|
| Scituate School Dept. |
17
|
100
|
41,365
|
| West Warwick School Dept. |
16
|
275
|
45,431
|
| Foster/Glocester Reg. School Dist. |
16
|
104
|
39,093
|
| Woonsocket School Dept. |
16
|
469
|
42,289
|
| Central Falls Collaborative |
16
|
166
|
44,896
|
| Portsmouth School Dept. |
16
|
211
|
43,065
|
| North Kingstown School Dept. |
16
|
307
|
41,183
|
| Little Compton School Dept. |
15
|
27
|
38,233
|
| North Providence School Dept. |
15
|
251
|
46,787
|
| Glocester School Dist. |
15
|
41
|
38,173
|
| South Kingstown School Dept. |
14
|
230
|
40,237
|
| Coventry Fire Dist. |
14
|
7
|
33,822
|
| Town of North Smithfield |
14
|
14
|
15,970
|
| Chariho Regional School Dist. |
14
|
248
|
40,728
|
| Bristol Warren Reg. School Dist. |
14
|
296
|
41,421
|
| EAST GREENWICH-COLA-NC |
13
|
15
|
17,591
|
| North Smithfield Police Dept. |
13
|
15
|
26,427
|
| East Greenwich School Dept. |
13
|
175
|
41,045
|
| Burrillville School Dept. |
13
|
158
|
42,284
|
| Cranston Police |
13
|
8
|
41,956
|
| Westerly School Dept. (NC) |
13
|
8
|
13,585
|
| Westerly School Dept. |
12
|
217
|
43,149
|
| State |
12
|
10,945
|
27,139
|
| City of Pawtucket |
11
|
105
|
20,739
|
| Smithfield School Dept. |
11
|
173
|
41,023
|
| City of Woonsocket |
9
|
65
|
22,746
|
| Newport School Dept. (NC) |
9
|
171
|
16,049
|
| Jamestown School Dept. (NC) |
9
|
23
|
12,951
|
| Narragansett School Dept. |
8
|
123
|
40,643
|
| Town of South Kingstown |
8
|
25
|
25,559
|
| Warren Police Dept. |
8
|
25
|
24,693
|
| Narragansett Bay Commission |
8
|
38
|
19,563
|
| EAST GREENWICH-COLA |
7
|
14
|
29,504
|
| Jamestown School Dept. |
6
|
31
|
41,140
|
| City of Cranston |
6
|
79
|
17,879
|
| Town of Scituate |
6
|
16
|
14,945
|
| Exeter/West Greenwich Reg. Schools |
5
|
75
|
39,039
|
| Town of Johnston |
5
|
38
|
19,537
|
| East Providence Schools (NC) |
5
|
304
|
15,041
|
| Central Falls School Dist. (NC) |
5
|
42
|
11,350
|
| East Greenwich Police Dept. |
5
|
22
|
32,698
|
| Middletown Public Schools (NC) |
5
|
22
|
18,716
|
| R.I. Airport Corporation |
5
|
22
|
43,537
|
| Glocester School Dist. (NC) |
4
|
23
|
9,698
|
| Town of Warren |
4
|
46
|
10,211
|
| Newport Housing Auth. |
4
|
26
|
21,796
|
| Bristol Warren Reg. School Dist. (NC) |
4
|
79
|
12,882
|
| North Providence Fire Dept. |
4
|
55
|
29,392
|
| Johnston School Dept. (NC) |
3
|
149
|
11,802
|
| North Kingstown Police Dept. |
3
|
30
|
33,592
|
| Cranston School Dept. (NC) |
3
|
418
|
12,929
|
| South Kingstown School Dept. (NC) |
3
|
117
|
12,226
|
| Scituate School Dept. (NC) |
2
|
41
|
10,525
|
| Tiverton School Dept. (NC) |
2
|
45
|
8,570
|
| Chariho Regional School Dist. (NC) |
2
|
47
|
14,184
|
| Woonsocket Police Dept. |
2
|
52
|
32,490
|
| City of East Providence |
2
|
62
|
27,958
|
| Pawtucket School Dept. (NC) |
2
|
377
|
10,952
|
| Cumberland School Dept. (NC) |
2
|
127
|
8,359
|
| Town of Bristol |
1
|
70
|
12,936
|
| North Kingstown School Dept. (NC) |
1
|
160
|
10,849
|
| Woonsocket School Dept. (NC) |
1
|
257
|
9,536
|
| Town of North Providence |
1
|
132
|
8,424
|
|
Notes: |
|||
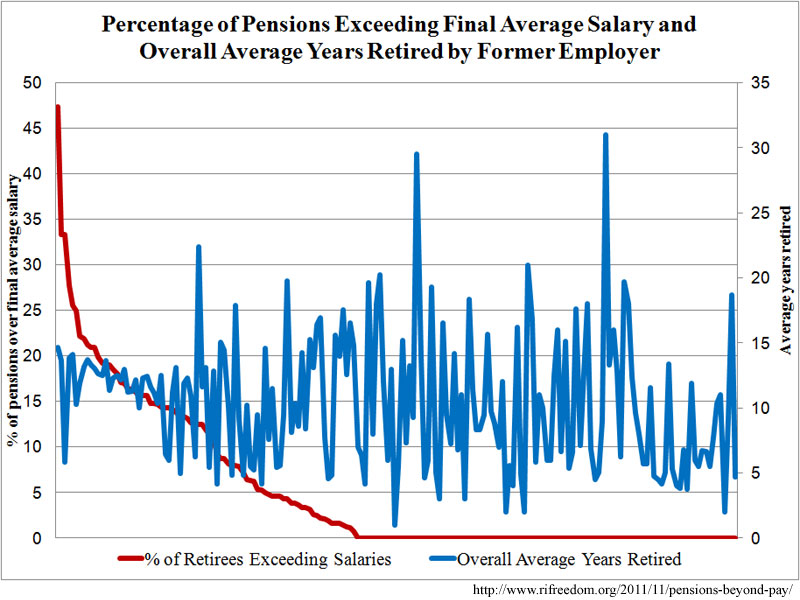
With some notable exceptions, schools in general and teaching staffs in particular dominate the list for retirees who make more in retirement than while working. And teacher pensions tend toward the higher end of the dollar scale. However, there is no apparent correlation between the percentage of retirees over-earning their working salaries and the average number of years that each entity’s pensioners have been retired:
Leave a Reply
Want to join the discussion?Feel free to contribute!