
2015 Report Card FAILS to Provide Equal Opportunity for Rhode Islanders
The Center’s 4th annual REPORT CARD demonstrates how RI’s political class continues to cater to special insiders, while depriving other Rhode Islanders of the opportunity for upward mobility, educational opportunity, and personal prosperity.
[button url=”https://rifreedom.org/RIReportCard/” target=”_self” size=”medium” style=”royalblue” ] 2015 Report Card [/button]P3: a Compelling Delivery Model for Governor’s Proposed Infrastructure Upgrades
A P3 Model would bypass the troubled RI DOT and enable a private sector partner to deliver vital bridge and road repairs in a timelier, safer, and less costly manner. WOULD REMOVE ALL RISK OF COST OVER-RUNS FROM RHODE ISLANDERS!
[button url=”http://www.rifreedom.org/p3/” target=”_self” size=”small” style=”royalblue” ] Read the Policy Report [/button]
Governor’s BOND & TOLL plan will waste over $650 million
PAY-AS-YOU-GO a Superior Approach.
The plan under consideration would more than double the cost of the project and would enrich special-interests without any added benefit for Rhode Islanders. The Center’s new report shows how to make RhodeWorks “work” for Rhode Island.
[button url=”https://rifreedom.org/2015/07/making-rhodeworks-work-for-rhode-islanders/” target=”_self” size=”medium” style=”royalblue” ] Read the PayGo Report here [/button]The Math of Educational Choice
Introducing the RI-DIMES Fiscal Modeling Tool
Empowering parents with greater choices when it comes to determining the best educational path for their children is not only supported by strong moral arguments, but can also lead to a net positive fiscal impact on the bottom line of public school districts, very different from the math of charter schools.
Read “The Math of Educational Choice” report
Click here for a school-district by school-district summary table of fiscal results
EXECUTIVE SUMMARY

The Center, in conjunction with a PhD economics professor, has developed a fiscal modeling tool, Rhode Island District Impact Model for Educational Scholarships (RI-DIMES), that can project the statewide and district-by-district fiscal impact of the educational scholarship program component of the 2015 bipartisan legislation submitted in both the Rhode Island House of Representatives and Senate. In March 2015, the Center published a report, The Way of the Future, describing the Bright Today Scholarship program outlined by the legislation.
The RI-DIMES projections demonstrate that conventional beliefs about the fiscal effects of voucher-type scholarship programs exaggerate
the risk and, if the policy is well designed, do not apply at all.
In the first year, with fewer than 3% of public school students expected to opt for scholarships, which are capped at $6,000, RI-DIMES projects, under the “core” policy providing scholarships to current public school students who migrate out of the system (including new students), that:
- Public school districts will see large aggregate net fiscal savings. With statewide savings expected to reach $17 million, 33 of 36 local districts will realize net savings in the first year. This figure could rise to $32 million per year and include all districts but one, under more-optimistic assumptions.
- Funding per public school student will actually rise in every school district, by an average statewide increase of $316.
- Total public and private spending on education will increase by $17.2 million, because the scholarships will provide an incentive for families to invest more of their private dollars into their children’s education.
When considering a “universal” policy as described in current legislation, in which current private school students are also granted partial scholarships, the net fiscal impact for public school districts is diminished, providing a wider range of possible first-year outcomes:
- Under the projected assumptions, statewide savings would drop to about $1.85 million, with 50% of the public school districts still realizing net savings.
- Under more-optimistic assumptions, all but
one school district would realize net savings, with the statewide total savings approaching
$18 million per year.
With our public school buildings in dire need of repair and maintenance, and with property taxes already high across the state, the proposed educational savings account legislation in just five years could free up $85 million to $150 million in revenue that could be applied to relieve these two pressing issues.

School Choice Saves Money for School Districts!
Families can be empowered with choices and student achievement can increase … while public school districts can realize net fiscal savings.
Bright Today Education Scholarships are the way of the future!
[button url=”https://rifreedom.org/?p=13690″ target=”_self” size=”medium” style=”royalblue” ]Read “The Math of Educational Choice” report[/button]Analysis: RhodeMap RI would further weaken Ocean State’s struggling economy
Go to Property Rights / RhodeMapRI home page …
Our Rhode Island Center for Freedom & Prosperity, URI Professor Len Lardaro, the RI Public Expenditure Council, Mayor Allan Fung, and many other organizations have been critical of the proposed RhodeMap RI economic development plan for its fundamental lack of basic economics; that despite some worthwhile goals, there is no specific road-map offered to attain those goals. With the credibility of RhodeMap RI already in question as a building-block plan for the Rhode Island economy, upon closer inspection, it appears that RhodeMap RI may actually contain recommendations that would be destructive to family budgets, economic growth, and job creation.
1) NO COSTS-BENEFIT ANALYSIS
First, RhodeMap RI does not even attempt to address the core cost-benefit analysis that any credible economic development plan should ask: How much will it cost; what are the projected returns? As the plan itself states on page 178, “With few exceptions, everything in this plan requires funding,” yet it goes on to say “… this plan does not present solutions to the issue of funding …” To whom will the funding plan be handed, then, to figure out? Obviously, with no investment levels specified, neither are there any return on investment projections.
2) MORE GOVERNMENT-IMPOSED BURDENS ON THE BUSINESS COMMUNITY
Second, given our state’s persistently poor national rankings over the years in headline after headline, there can be no question that the government-centric public policy approach – that has dominated our state for decades – has been an abject failure. RhodeMap RI would accelerate this failed approach by inserting government into even more aspects of our personal and business lives, adding new burdens on our state’s already struggling economy.
Appendix A describes the social equity principles of the plan, which, if adhered to, would place new burdens on the business community. This sentiment was echoed by John Simmons of RIPEC at the November RhodeMapRI consortium meeting. Similarly, Mayor Allan Fung expressed similar concerns in a letter he sent to the planning council. Forcing businesses to comply with new social-equity guidelines would further harm our state’s last-place business climate and would limit business relocation and growth in our state … at a time when we should be tearing down barriers to economic growth, not erecting new barriers.
Subsection B of the Appendix discusses “living wages”, which, if referring to further minimum wage hikes, would actually increase the cost of employment in our state and would further burden employers, leading to fewer jobs for people looking for work. Policies regarding wage rates must be reserved for General Assembly debate, not adopted as a principle in a bureaucratic document outside of the legislative process.
3) ANTI FREE-MARKET APPROACH
Third, RhodeMap RI’s open disdain for the free-market system should be of concern to every resident in our state hoping to participate in a booming private sector. Subsection C of the appendix is direct in its anti-business nature; “Use public funds for public good, especially for marginalized populations … not private profit … to finance projects that overwhelmingly benefit big business.” Mayor Fung points out the success that he and the City of Cranston have had in public-private partnerships and questions whether smart growth plans would be wise to preclude such partnerships, which could employ hundreds or thousands of Rhode Islanders.
Further, the actual Minutes from the October 16 Consortium Meeting offer more distrust of the free-enterprise system, stating: “The market will never take care of marginalized populations. Consequently the plan has to have sticks (laws/regulations) for things the market won’t otherwise do, as well as carrots (incentives).”
4) FAMILIES TO BEAR PROPERTY TAX HIKES
Fourth, the sticks and carrots that RhodeMap RI contemplates would manifest via manipulation of local property taxes so that they become a weapon against those who do not live in preferred communities and as a reward to those who obey the plan. Annual property tax caps in municipalities would be wiped away, leading to unchecked residential and commercial property tax hikes, as one means to fund the ‘growth centers’ the plan envisions.
Page 159 of the plan itself discusses that local property taxes are already too high across most of Rhode Island, yet it is precisely an increase in these same local taxes that the RhodeMapRI plan relies upon. How can this make sense?
Subsection C also recommends creation of “Community Benefit Agreements” that would somehow ensure that “current housing costs” are maintained for people or businesses that may be displaced during development. This rent-control concept is a failed idea from the past and would artificially distort the normal housing and rental markets. Further, someone would have to pay to ensure these price-control guarantees … either landlords or taxpayers … and such unfunded-mandates would result in even greater economic decline for those communities and for our state.
Finally, with local and state taxpayers in mind, Page 141 of the plan discusses “resiliency” provisions that would require significant investment to “increase the state’s resiliency to climate change.” The cost of developing such climate change resiliency infrastructures would certainly be high. The return on investment of such projects is unspecified, and, with recent history as a guide, often produces negative economic impact. Such, costly, unproven, even un-necessary burdens on taxpayers, with high potential unintended costs to state and local economies, is not a risk our state should commit to at considering its present fragile status.
CONCLUSION
It is the position of the Center and most economists, that the free-market capitalist system has raised the standard of living of more people across the world than any other system ever devised by man. RhodeMap RI , with its big government and anti-enterprise approach, would turn this system on its head in the Ocean State.
If our state is to return prosperity to its residents, a new era of public policy, free from oppressive government regulations and taxations … not more of it, per the RhodeMap RI scheme … must be the “rhode” the Ocean State takes. The free-market should be freed to work its ‘invisible hand’, and government should get out of the way. If adopted, Professor Len Lardaro suggested the plan be renamed – TrainWreck RI; we regrettably concur.
Mike Stenhouse is CEO for the RI Center for Freedom & Prosperity and holds an Economics degree from Harvard University.
Freedom Index: Description and Methodology
Go to main Freedom Index page.
The index examines legislators’ votes in terms of their likely effect on the free market, the size and scope of government, the balance of residents’ interests against those of public employees and beneficiaries, and the constitutional structure of a divided government with limited power over the people whom it represents. The Center reviewed every bill that received a roll-call vote by the full membership of either chamber and selected 96 that fit its understanding of these criteria. (Companion bills only count once.)
The resulting scores give a detailed sense of each legislator’s priorities beyond a few high-profile issues.
The Center further divided the bills into five categories:
- Tax & budget: bills that affect the tax structure in Rhode Island and/or that relate to government expenditures, just driving or relieving the pressure on taxation
- Regulatory environment: bills that make it more or less difficult to live and do business in the state by imposing regulations
- Constitutional government: bills that affect the structure of the government, as well as the scope of government in its authority over residents’ lives
- Public sector labor: bills related to the relationship between its employees and itself and the electorate
- Education reform: bills that advance or impede the reform of the state’s public education system, in terms of both cost and quality
Most legislation has implications for more than one of these categories. For the purposes of this index, we applied our subjective sense of the area of core effect and sorted the bills accordingly. If, for example, a bill having to do with education seemed to us intended to secure the role of public employees, we classified that bill as Public Sector Labor, not Education Reform.
The Center selected legislative bills for inclusion in the Freedom Index if they were deemed to have an effect on free-market, small-government, or constitutional principles, with each bill assigned a positive or negative weighting based on the criteria listed below. Weighted points for each bill were given to each legislator based on his or her roll-call vote on it.
Each legislator’s final Freedom Index was calculated as his or her score’s percentage of the total possible points. A positive score indicates a voting record that generally protected individual and economic freedoms, while a negative score reflects the opposite.
Disclaimer: It should be noted that the total Freedom Index score generated for each legislator is a direct reflection of the perspective of the RI Center for Freedom & Prosperity when it comes to the weighting of each bill. The Freedom Index is not an absolute measure of a legislator’s merit and does not constitute any endorsement or individual criticism. The Freedom Index is a tool designed for general research and for accountability, giving voters some quantitative metrics for their own assessments as to their elected legislators’ performance.
Methodology
1) Determine weighting: Each selected bill received a weight ranging from +3 to -3, as determined by the RI Center for Freedom & Prosperity. Negative weights indicate legislation that creates or expands an agency, government program/function, or tax; creates new regulatory burdens; is hostile to constitutional principles; or otherwise conflicts with the principles that guide the Center. Positive factors were assigned to bills in line with those principles. Companion bills in the House and Senate were weighted identically. To determine the weightings, the Center requested reviews of all chosen legislation from a half dozen engaged Rhode Islanders with similar principles and combined the range of results for a final weighting.
2) Determine vote: Each legislator received a +1 or -1 vote factor, depending on whether he or she voted FOR or AGAINST a particular bill, respectively. If a legislator did not vote on a bill, he or she received a +0.25 if the bill passed or a -0.25 if the bill failed. Legislators who abstained from voting received a +0.75 or a -0.75 vote factor depending on if the bill passed or failed.
3) Calculate weighted vote: Multiplying the weighting factor and the vote factor produced a weighted vote score for each legislator for each bill.
4) Calculate the legislator score: The cumulative score for all bills for each legislator determined that legislator’s overall score.
5) Calculate Freedom Index: Dividing each legislator’s total score by the maximum possible for the appropriate chamber provided his or her Freedom Index, or a percentage of the best possible score he or she could have achieved. In 2014, the “perfect” scores are 99 for the House and 117 for the Senate.
For example, consider a bill that would increase the regulatory burden significantly in Rhode Island and that the Center therefore weighted as a -2. Legislator A voted for the bill. His or her weighted vote would be calculated as follows: -2 x 1 = -2. Conversely, the weighted vote for Legislator B, who voted against the bill, would be: -2 x -1 = 2.
If Legislator A, in the House chamber, earned a total legislator score of -33, his or her Freedom Index would be calculated as: -33 ÷ 143 x 100 = -23.1. If Legislator B in the Senate had a total score of +23, his or her Freedom Index would be calculated as: 23 ÷ 133 x 100 = 17.3.
To rank the legislators, the Center sorted them by their Freedom Index scores and then, in the cases of ties, by their scores in each category, in the following order: Regulatory Environment, Tax & Budget, Constitutional Government, Public Sector Labor, and Education Reform. When legislators’ results were still identical, the Center adjusted them in order of their apparent stature and power within their chambers.
Criteria
In determining each bill’s weighting, the following questions were considered:
- Does the bill create or eliminate an agency, program, or function of government?
- Does it give the government new or expanded power to prohibit or restrict activities in the free market? Examples may include licensure and other restrictions on legal business practices.
- Is it unconstitutional or does it do violence to our concepts of federalism or separation of powers? Does it restrict property, speech, gun, or other constitutionally recognized rights or freedoms? Conversely, does it restore balance between the state and federal government, resume state authority over an issue under the 10th Amendment, or remove restrictions on constitutionally protected rights?
Other considerations were also brought into question:
- Does the bill redistribute wealth or use tax policy or other incentives to reward specific interest groups with special favors or perks? Conversely, does it eliminate special favors and perks in the tax code or public policy?
- Does it perform a function that can and should be performed by the private sector or restore functions to the private sector?
- Does it grow or shrink the regulatory scope of an agency?
- Does it directly or indirectly create/reduce taxes, fees, or other assessments?
- Does it increase or decrease control of the private sector through rules, regulation, or statute?
- Does it increase or decrease long-term debt or override or restore statutory or constitutional protections against long-term debt?
- Does it give or reduce special benefits for government employees or politicians?
- Does it promote government transparency and openness or does it restrict access to information that should be in the public domain?
It should be noted that the complexity not only of the law but of political theory in general can make assessments of the sort described above subjective and very difficult. People reviewing the index should consider the results to be the best judgment of the Center, given our collected experience and expertise.
Each legislator received a +1 or -1 vote factor, depending on whether he or she voted FOR or AGAINST a particular bill, respectively. If a legislator did not vote on a bill, he or she received a +0.25 if the bill passed or a -0.25 if the bill failed. Legislators who abstained from voting received a +0.75 or a -0.75 vote factor depending on if the bill passed or failed.
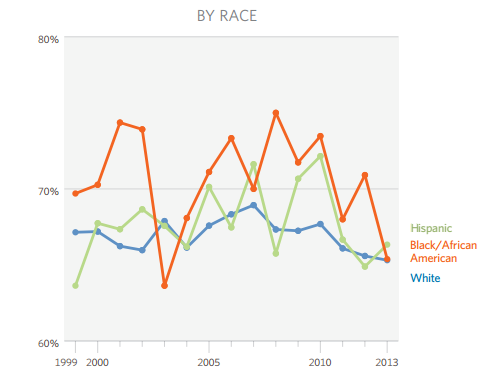
Workforce Participation Decline in RI Dismal for Women & Minorities
Read how poor public policy in Ocean State is especially hurting non-white men!
[button url=”http://www.rifreedom.org/jobs” target=”_self” size=”medium” style=”royalblue” ] View Workforce Data here [/button]THEY KNEW! 2009 Brief Advised Against Healthcare Exchange for RI
They Knew!
Ignoring the advice of her own specially convened study process, Lt. Gov. Elizabeth Roberts became one of the leading figures in promoting a complex, costly health insurance exchange for Rhode Island. Further,
HealthSourceRI officials and supporters continue to tout a cost containment goal that the process advised is not achievable according to a little known 2009 Issue Brief provide to Ms. Roberts and other state officials! Our Center’s analysis of this Brief can be downloaded by clicking the button below:

MEDIA RELEASE, June 3, 2014: Specifically advised “Do not pursue” in 2009 by her own specially convened study group, regarding formation of a state-based health insurance exchange, as it would not be fiscally viable and would not meet its primary objective of cost containment, Lieutenant Governor Elizabeth Roberts of Rhode Island nevertheless pressed for the formation of a state-run ACA exchange and has remained one of its most outspoken advocates. This according to the Rhode Island Center for Freedom and Prosperity, a nonpartisan think tank, which today published an analysis of a little known Issues Brief funded by the Robert Wood Johnson Foundation and presented to state officials years ago.
“There has never been a rigorous public debate about the pros and cons of a state-funded exchange for the Ocean State. With tens of millions of dollars now at stake, we need a renewed discussion today,” commented Mike Stenhouse, CEO for the Center, referring to the abbreviated process that saw related legislation fail in the General Assembly in the spring of 2011, only to have the exchange authorized without advance public scrutiny later that fall by Executive Order of the Governor. “Revelation of this Brief raises many questions. Why was this information not brought to light in 2011? Why do State and HealthSourceRI officials continue to tout claims that their own study advised are not feasible? We must have answers to these questions before we spend $15 million in next year’s budget.”
The findings in the Brief validate many of the specific concerns raised by the Center in recent reports. In additional to clearly indicating that the study group’s number one preferred objective – to drive down healthcare costs – was not achievable via a state exchange, the 2009 document also advised that Rhode Island’s economy was not strong enough, that there was not a large enough insured population, nor was their a complex enough insurance provider/product market that required coordination, to justify the “establishment of a new administrative structure” to operate an exchange. Further, the Brief advised that because of these characteristics a “health insurance exchange may not generate sufficient volume to be cost-effective.”
“As a state, we are now facing the precise sustainability problems that our Center projected two years ago, that this Brief advised against five years ago, and that has been empirically supported by results from Massachusetts for the past six years,” added Stenhouse. “The small business sector in our state has been deceived into supporting a massive bureaucracy that, sadly, will not reduce their health insurance costs.”
Links to other related information about this issue, including two reports by the Center and a Forbes.com analysis, can be found on the Center’s home page for the health exchange issue at RIFreedom.org/Exchange.