Health Benefits Exchange Surge of Enrollments, Still Expensive

HealthSource RI has published its enrollment numbers from its opening to January 4, after the deadline to enroll for January coverage.  In continuation of our series putting the number in context, we herein present them with reference to the federal millions that taxpayers provided in order to create an online government broker for Rhode Island’s extremely limited health insurance options.

According to the Center for Consumer Information & Insurance Oversight, under the federal Centers for Medicare & Medicaid Services, the federal government has given $134.7 million in grants aimed, at least in part, at getting Rhode Island’s Affordable Care Act health benefits exchange, HealthSource RI, up and running. Of that, $99.1 million went directly to the Rhode Island government.

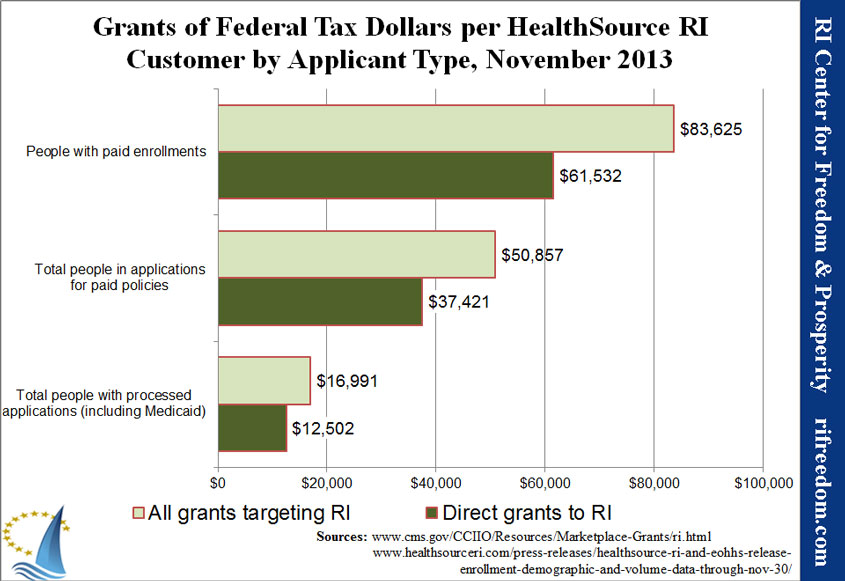
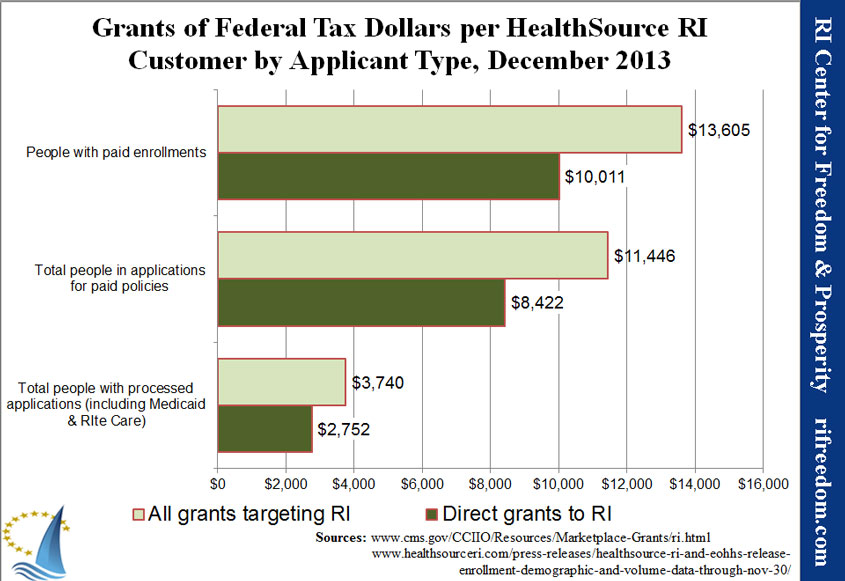
As the following chart shows, even with the last-minute rush for plans, U.S. taxpayers have spent $10,011 in direct grants for each of the 9,902 Rhode Islanders who have officially enrolled (having paid their initial premiums).

taxpayercostperHSRIenrollment-122013

Adding in the 1,868 people who have completed the application but not yet paid an initial premium, the per-person subsidy decreases to $8,422.

The largest group of enrollees, however, includes the 24,252 Rhode Islanders who used the subsidized health insurance exchange to discover that they are eligible for free healthcare, through Medicaid or the state’s RIte Care program. (Rhode Island opted to follow the Affordable Care Act in expanding the categories of people who are eligible for Medicaid, to include able-bodied, childless young adults.)

That’s 67% of the 36,022 who have completed the application process, a percentage that’s unchanged from last month.  It’s impossible to know how many of those enrollees are new to Medicaid or were already eligible before the Affordable Care Act, but it would appear that the state is well on its way to the 41,185 new people dependent on the government for health insurance that the Kaiser Foundation predicted by 2019.  As the Center pointed out when the state was deciding how to respond to the Affordable Care Act, this expansion could cost Rhode Island taxpayers nearly $60 million per year (and almost half a billion dollars in state and federal spending).

On the other side of the spectrum, only 1,545 (like last month, 4%) are enrolling in plans without claiming additional taxpayer subsidies in the form of financial assistance on their premiums and other expenses.

OpEd: Repeal or Roll-back Anti-growth Laws

OpEd by Mike Stenhouse, CEO, as it was published in the Providence Journal, 1/12/14

As the 2014 legislative session begins, the leaders of Rhode Island’s political class have signaled that they will not let themselves consider any big ideas to boost our state’s stagnant economy or to improve our dismal jobs outlook.

There has been much speculation about what issues the General Assembly will take up. Unfortunately, if recent history is our guide, legislators will do more harm than good, as they see it as the government’s duty to help those who they perceive are in need — those who are harmed by the very policies their predecessors have implemented over the years.

Click here for ProJo link, to view/post public comments

Indeed, public policy in the Ocean State is tearing families apart. We all know of a recent graduate, often one of our own children, who has left town to look for work in a more fertile state; one of our parents who has retired to a lower cost-of-living state; a prominent business or community leader who has fled to avoid taxes on his or her heirs; or a business owner or entire family that has simply uprooted and moved to regions that offer more opportunity.

The government of Rhode Island has implemented dozens of taxes and regulations that have proven harmful to economic growth and job creation. In far too many categories, Rhode Island ranks at or near the bottom — a last-place team.

Yet political leaders act as if they’re not allowed to do anything about it, rather than seeing the status quo as the enemy of our future.

Instead of creating new Band-Aid fix bills, maybe lawmakers should eliminate some of the statutes that have harmed our chances for prosperity in the first place. The most productive path for legislators in 2014 may be to wipe out destructive policies.

Perhaps the General Assembly should be judged this year not by how many new policies it creates, but by how many existing, anti-growth policies it repeals or rolls back.

For starters, we could repeal or roll back the state’s regressive sales tax; or the requirement that families have no choice on what schools best educate their children; or punitive estate taxes that drive wealthy people to other states; or restrictions on out-of-state companies to sell health insurance in Rhode Island; or the minimum franchise tax, which stifles entrepreneurship; or corporate welfare, to level the playing field; or even renewable energy mandates that drive up costs for every family and business. All of these policies have created a drag on our economy, reducing opportunities for those who wish to succeed.

We continue to inflict legislative wounds on ourselves. We are suffering death by a thousand cuts. Isn’t it time we reversed course and healed some of these wounds?

To do this, we would also have to roll back spending levels, the holy grail of the political class; spending levels that fabricated the very same onerous taxes and fees that are the root cause of our economic woes. This seems beyond the imagination of the political class. Yet, this is allowed. Other states are doing it. We are allowed to change course and create a brighter future for ourselves.

Rhode Island is not defined by its government or a budget number at the bottom of a spreadsheet. Rather, Rhode Island is about the hopes and dreams of real people and real families. We should no longer be held hostage by a failed budget. Should our lives and chances for prosperity be restricted by a number? Or, rather, should the budget be crafted to serve our needs? Which should be the higher priority: the well-being of real people or an arbitrary revenue figure? In Rhode Island, we have it precisely backwards.

If we can roll back certain taxes and spending levels, and if the political class can prioritize the well-being of its residents over its fixation on revenues, tens of thousands of new jobs could soon be created, along with a lower cost of living and renewed opportunities for all Ocean State families and businesses.

We must free ourselves from burdensome taxes and a culture of dependency, and be unleashed to improve our own lives and prosperity.

As an analogy, we don’t have to look any further than the 2012 Boston Red Sox, which, as a last-place team, fired its manager, traded away expensive, non-productive players, and brought in fresh talent. The Sox reinvented themselves, and became World Champions just one season later.

Rhode Island faces a similar situation: We must demand new leadership, repeal non-productive policies, and right-size spending. We can do this. It is allowed!

Rhode Island: A Growing Population in an Abysmal Economy

The U.S. Census is out, today, with updated estimates for the populations of each state.  The real telling data will come next month, when the Census releases the more detailed results about immigration, births, deaths, and age brackets.

Nonetheless, the buzz has begun, because 2013’s small population increase follows eight years during which Rhode Island’s population declined; this decade, it was the only state to have that result twice in a row.  That potentially positive result comes with some important caveats, however.

The Census changed methodologies, this year.  Because the change applied evenly across the states, there isn’t any obvious reason why it should have affected the Ocean State differently.  On the other hand, if it turns out that the agency captured a particular group more precisely and Rhode Island’s peculiarities make that group more significant, it could have made the numbers not entirely comparable from year to year.

The Ocean State is still estimated to be below its 2010 Census count.  In fact, it’s one of only two states of which that’s true, and is many times worse off than Maine, which barely edged into the category this year.

Rhode Island is still in the bottom 10, with year-over-year growth one-seventh the size of the national average. Our economy, our retirement systems, and our social institutions rely to some extent on a certain amount of growth.  In that regard, growth below that amount is tantamount to a decrease in its effect.

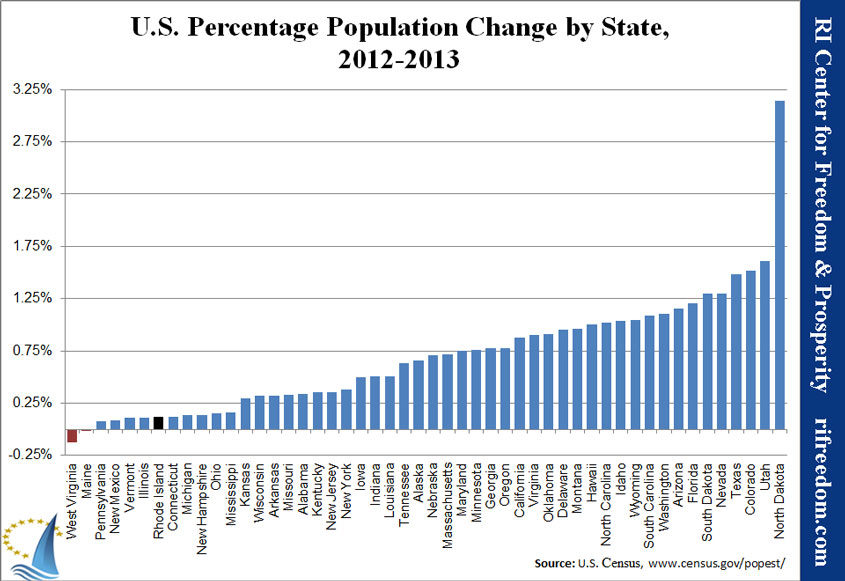
Policy differences make it telling which states are on the other end of the rankings.  One reason that state population growth rankings are an important indicator is that it gives some idea which sorts of policies attract immigrants, give retirees a reason to stay put, and make young families optimistic enough to have babies.  The following chart shows the states ranked by their year-over-year percentage increases.

USstates-popchange-2012-2013

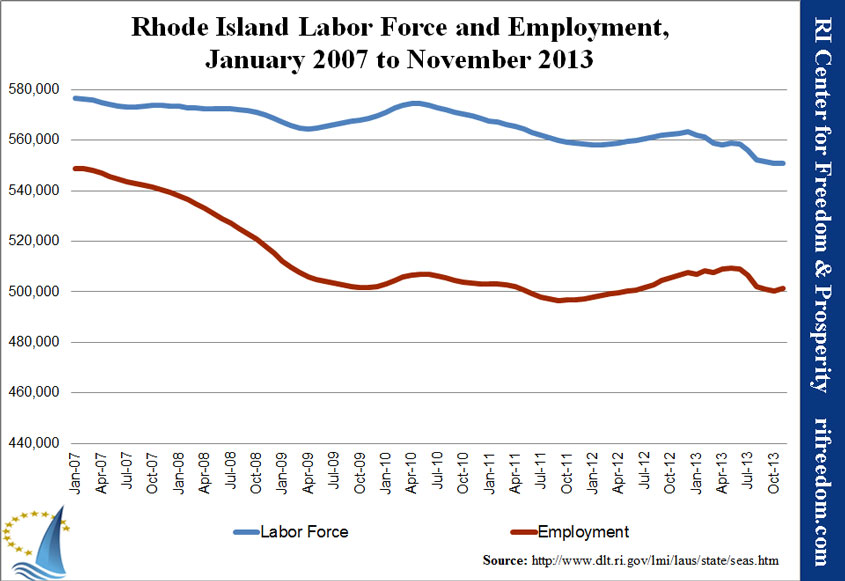
A growing population isn’t necessarily a good thing in conjunction with other data. Every month, we’ve tracked the shrinking of Rhode Island’s labor force; that’s the total number of Rhode Islanders who are either working or actively looking for work.  If Rhode Island’s population is growing but fewer people are participating in the state’s workforce, then there are more people who aren’t contributing to the state’s economic output. There are also potentially more people who are taking advantage of government programs, for which money must be taken out of the economy.

The population casts a dark light on Rhode Island’s unemployment rate. For November, Rhode Island was tied with Nevada for the worst unemployment rate in the country.  The unemployment rate is the percentage of people who are counted within the labor force and who say that they are not employed.  In stark contrast to Rhode Island, Nevada is on the right side of the above chart, indicating that its population is growing relatively quickly.  In other words, Nevada’s unemployment rate is more an indication that it’s having to find work for a growing number of people; that’s a much more optimistic way to be tied for last place in unemployment than Rhode Island’s perpetual stagnation and decline.

Rhode Island Employment Snapshot, November 2013: Tied for Last

Rhode Island’s unemployment rate fell to 9.0% in November, but that wasn’t enough to keep the state from falling to status as tied for worst.  According to the statistics published by the federal Bureau of Labor Statistics (BLS), 1,044 more Rhode Islanders reported being employed than did the month before, and 130 more people reported that they’re either working or looking for work.

As the first chart below illustrates, the state has gotten at least a one-month reprieve from its precipitous drop in employment, which may keep the Ocean State from crossing some worrisome thresholds before the end of the year, such as having fewer people in the labor force than were employed in January 2007.

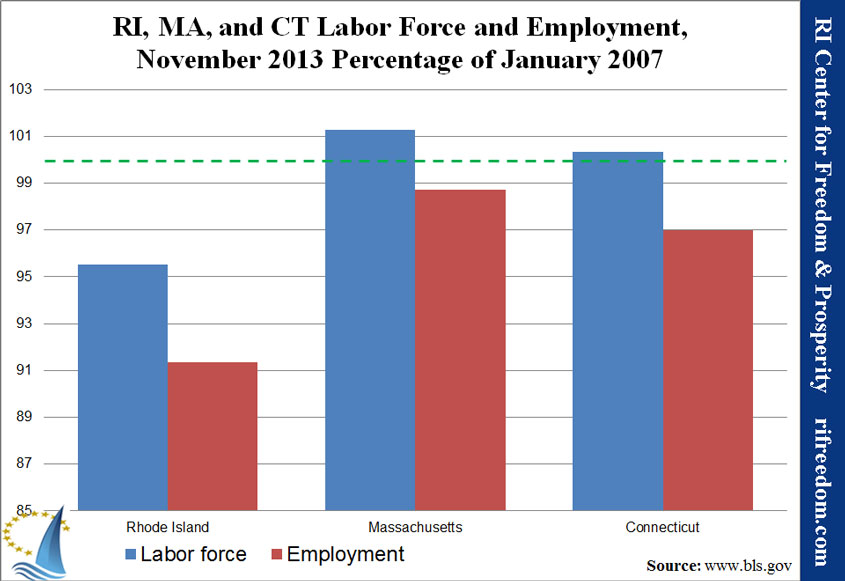
The second post gives a view of the state’s small improvements in the context of its great distance from peak employment.

RI-laborforceandemp-0107-1113

RIMACT-laborforceandemp-1113perc0107

Tens of Thousands in Taxpayer Start-Up Dollars per HealthSource RI Enrollee

With HealthSource RI’s release of its latest enrollment data, we herewith update our post from last month, breaking down the per-beneficiary expense in federal grants by various categories.

By way of a reminder: According to the Center for Consumer Information & Insurance Oversight, under the federal Centers for Medicare & Medicaid Services, the federal government has given $134.7 million in grants aimed, at least in part, at getting Rhode Island’s Affordable Care Act health benefits exchange, HealthSource RI, up and running.  Of that, $99.1 million went directly to the Rhode Island government.

Thus far, U.S. taxpayers have spent $61,532 in direct grants for each of the 1,611 Rhode Islanders who have officially enrolled (having paid their initial premiums).

taxpayercostperHSRIenrollment-112013

Adding in the 1,038 people who have completed the application but not yet paid an initial premium, the per-person subsidy increases to $37,421.

The largest group of enrollees, however, includes the 5,280 Rhode Islanders who used the subsidized health insurance exchange to discover that they are eligible for free healthcare, through Medicaid.  (Rhode Island opted to follow the Affordable Care Act in expanding the categories of people who are eligible, to include able-bodied, childless young adults.)  That’s 67% of the 7,929 who have completed the application process.

Of that number, only 313 (or 4%) are enrolling in plans without claiming additional taxpayer subsidies in the form of financial assistance on their premiums and other expenses.

Analysis of STAMP & REMI Economic Modeling Programs

At the December 3rd hearing of the Joint Legislative Commission to Study Repeal of the Sales tax, the Rhode Island Center for Freedom and Prosperity defended the projections in its original Zero.Zero Sales Tax Report by the STAMP model, and also questioned the underlying assumptions of the REMI model used by the Rhode Island Department of Revenue to question those findings.

The Center is not alone in sharing its concerns about the REMI tool, a two prominent organizations have also published related papers:

  • The second paper – BHI on Modeling State Tax Policy – was created by the head of the Beacon Hill Institute, which developed the STAMP model. A PHD economist and professor at Suffolk University, Dr. David Tuerck discusses the appropriateness of modeling state tax policy on “Keynsian” economic theories, theories that government spending is a spur to consumption, as opposed to the “classical” model, which believes that government spending inhibits savings and investment.
  • (Update May 2014: On May 21, 2014, The Institute on Taxation and Economic Policy (ITEP) released a report entitled, “STAMP is an Unsound Tool for Gauging the Economic Impact of Taxes”  The report makes several criticisms of the Beacon Hill Institute (BHI) State Tax Analysis Modeling Program (STAMP®). In the following link, BHI responds to the criticisms contained in the Executive Summary of the report. Response to ITEP Critique )

The full related testimony at that hearing of Mike Stenhouse, CEO for Center, is below.

December 3, 2013

TO: Joint Sales Tax Study Commission #6
FROM: Mike Stenhouse, CEO
SUBJECT: Prepared Testimony Remarks

Mr. Chairman, Commission members – good to be back with you.

Today, I have two topics to cover. First, some comments on the economic modeling tool issue that was the subject of Paul Dion’s testimony. Second, as requested by Chairman Malik and other commission members, I’d like to review our Center’s new report displaying projections, from alternative sales tax reduction scenarios that we ran through the STAMP model.

Now, with regard to comparing economic modeling tools, I’d like to take a (more) results oriented, practical and empirical angle (vs Mr. Dion’s more technical analysis). If I may paraphrase Joe Henchman from the Tax Foundation in his testimony at the last Commission hearing … no model is 100% accurate, and the differences in the underlying assumptions of the models are vital to understand.

Let me first take a step back and remind you of some of the arguments that our Center – and others who have testified before this Commission – have been making. In summary,

  • The status quo is not adequately serving our state, we are not competitive with other states, and the need for bold action as part of a new public policy approach is required if we are to keep pace
  • The current spend and tax public policy culture – of government trying to serve the needs of too many at the expense of a growth economy – should be revisited; basically, that our state government is trying to do too much, with too small a tax base.

Our Center always knew that, ultimately, this sales tax debate, would lead to a larger, philosophical public policy discussion: Is our current approach working? If not, what underlying policy approach should our state adhere to instead? Indeed, the sales tax repeal issue before this Commission cannot ultimately be decided without considering the higher philosophy towards public policy.

The two economic modeling tools in question – REMI, used by the state; and STAMP, the model our Center has used in making its projections – as it turns out, represent a very similar philosophical challenge.

While we largely agree with Paul Dion’s testimony about the significant differences between the two models, it is unfortunate that members from the STAMP team are not hear today to refute, what we believe, were a number of mis-characterizations of the STAMP model by Mr. Dion. It is not the purpose of my testimony, nor is it within my skill set, to attempt to provide such rebuttals myself.

First, I’d like to echo thanks to Chairman Malik, the State Department of Revenue staff, the REMI staff, the STAMP staff at the Beacon Hill Institute who hosted us, John Simmons from RIPEC , and our staff for taking the time to look under the hood in attempting to compare these two models.

In the end (as Paul Dion has testified), here’s where we stand today: two models, two widely varying underlying assumptions, and two very different projections … so what’s a Commission member to make of it? One model assumes at its core that “government spending” provides a greater local economic impact than does “private spending”. The other model assumes the exact opposite.

Our Center is not alone in expressing the concerns we will discuss with you today about the REMI tool. In the next day or so, we will post on our website two papers that further discuss these modeling differences:

  • The first paper, published by the Cato Institute some years ago, discussed what it calls the “Misuse of Regional Economic Models” … like REMI.
  • The second paper was created just this week by the head of the Beacon Hill Institute, which developed the STAMP model. A PHD economist and professor at Suffolk University, Dr. David Tuerck discusses the appropriateness of modeling state tax policy on “Keynsian” economic theories, theories that government spending is a spur to consumption, as opposed to the “classical” model, which believes that government spending inhibits savings and investment.

This is the core of the debate, when considering these two modeling tools. And, let me say up front that there is no right or wrong answer that applies to all states. Different modeling tools based on differing economic assumptions may produce different projections in different states at different points in time based on differing fundamentals of their highly differentiated state economies.

But there is one critical and important question you should continually ask yourselves as you consider a course of action to recommend: in our state, in Rhode Island, is the status quo working for us? And should a modeling tool that supports the status quo be a factor in your determination of whether or not you will support significant sales tax reform?

The REMI model tends to show an economic benefit if we continue the high tax, high spending formula our state has deployed over the past decade or more. In fact, it would show that increasing government spending would be good for our economy.

Again apply the question: how has that spending formula been working out for Rhode Island lately?

The REMI model would similarly show that cutting government spending via tax cuts would be harmful to the economy. But, this is not what you’ve been hearing from the experts who have previously testified before you.

The STAMP model assumes the opposite: that government spending has the effect of “crowding out” the more vital private consumption … by affecting incentives to work, save, and invest. That lower levels of taxes and spending would, conversely, be good for our state’s economy. Clearly, a different approach.

Ask yourself a variation of the question: does RI’s economy need a tax policy change?

Let me give you a telling example. These differing philosophies and models can simply be explained by a discussion we had during our meeting in Boston a few weeks ago. We were discussing how STAMP showed that a 0.0% sales tax, with associated government spending cuts, would dramatically boost the economy via the benefits we’ve already put forth to this commission … and how REMI, conversely, projected a negative impact because of the reduced levels of government spending. I then asked the REMI representatives what the REMI model would show if, instead of reducing the sales tax by 7% to zero, the RI sales tax were to be raised by 7% to 14%, with all of that extra revenue collected to be spent by the state government. They replied that the REMI model would show a “positive” net impact for the economy.

Let me repeat, the REMI model would predict that doubling the sales tax would be good for Rhode Island. How many of you believe that would be the case? Isn’t this the same approach that has turned our Ocean State into one of the highest taxed, lowest performing states in the country?

Again, the important point is that, in our state, in Rhode Island, the status quo pattern of ever increasing government spending and taxation is not working for us!

You all already know –ad nauseum – about the persistent near last place rankings of our state. About families struggling and leaving town because of oppressive levels of taxation, and a lack of opportunity.

And remember that during the course of these hearings you have heard testimony about economic philosophies, from a national tax expert about the need for our state to become more competitive and to be known for something, about modeling projections that show enormous potential job growth, empirical data about how a zero sales tax state such as NH has won billions of dollars in retail sales from its VT and ME neighbors, research about how RI’s border population is more dense and more wealthy than NH’s (indicating that repeal of the sales tax might have an ever greater positive effect in RI), and you heard anecdotal evidence from person after person, student after student, family member after family member, and business owner after business owner, how repeal of the sales tax, and lower tax burdens overall, would be a help to their family finances and business prospects …

… that the status quo is the enemy of their futures.

Yet the REMI model, which in our view is symbolic of the status quo tax and spend approach, suggests we ignore this evidence and trust that more of the same is the answer for our state. I concede that that model and that philosophy may work in some states, but it is up to you – and this Commission – to determine if continuing this status quo philosophy is ever going to work for OUR state.

In fact, even State Tax Administrator, David M. Sullivan, said last week in the ProJo that the recent liquor/wine tax cuts should help to spur sales and boost the state’s economy at an important time for retailers. How does this statement square with the opposite findings of the department own REMI tool?

The STAMP model, the basis for the projections in our original Zero.Zero report and for the new projections I’ll soon share with you, provides a direct alternative to the status quo. Admittedly, and as Paul Dion has pointed out, the two models employ a dramatically different philosophical approach.

It is the job of this commission to determine if a tax policy change is needed. And, inevitably, this means that you must also endorse a specific economic philosophy. Does Rhode Island need a new approach?

If yes, and you believe the status quo is not acceptable, then we suggest that a modeling tool that places a premium on that new approach should be your guide – the STAMP model that our Center entrusts.

If not, and you believe that our state should continue with its status quo tax and spend policies, then you should continue to be guided by the state’s REMI model.

Allow me to present one other, we think, indisputable argument as to why you may choose to give more credence to the STAMP model: the report card our Center published shows that RI is the #1 state in the country when it comes to “income redistribution”: In other words, the highest level of government spending on certain groups, after collecting taxes from other groups. If government spending is indeed a stimulus to a state’s economy, as REMI assumes, and if RI has been doing this at a higher level than any other state, then it would stand to reason that we should have the nation’s best economy. Right? However, the vast majority of data indicates that the exact opposite is true.

In fact, in our state, in Rhode Island, some of the highest levels of government spending in the nation have led to one of the worst performing state economies in the nation. (Why would this Commission, or the General Assembly, turn away from a pro growth idea like repealing the sales tax, because of projections from a model that not only supports continued government spending, but actually projects that more of this failed medicine is the cure? It simply does not add up, at least in our state.)

To quote the Beacon Hill paper: The view that the path to economic expansion lies in combined spending and tax increases certainly does not fit the facts at the state level.

So let me conclude this portion of my testimony by reiterating that ultimately, this Commission’s recommendation about reforming the sales tax, will in essence, be a recommendation about whether or not you believe more government spending or more private spending is best; and whether or not our state should embark on a new policy path towards its future prosperity.

Center Defends Zero.Zero Report at Commission Hearing

A employee of the RI Department of Revenue, also a member of the Special Joint Legislative Commission to Study Repeal of the State Sales Tax, provided lengthy testimony at the December 3 hearing that questioned the Center’s Zero.Zero report and the modeling tool the Center utilized (STAMP) in making its jobs and revenue projections.

CEO Mike Stenhouse provided a rebuttal and also introduced a 3% sales tax scenario during his testimony.

* Read Stenhouse’s prepared remarks here …

* Watch the Capitol TV video here … http://ricaptv.discovervideo.com/embedviews/vod?c=all&w=640&h=480&s=1# Stenhouse testimony begins at the (115:45) mark. Note if link takes you to a generic page, find video in the menu from 12/3/2013.

– At the (134:20) mark the state employee says that … “It’s not a question of are we doing the right thing, or how’s that worked so far, etc …”. Really?

Zero.Zero and the Municipal Property Tax Cap

At last night’s meeting of the Special Joint Legislative Commission to Study the Sales Tax Repeal Act of 2013, Director of Revenue Analysis in the Rhode Island Department of Revenue Paul Dion stated that municipalities would be prevented from realizing the increase in local revenue that the RI Center for Freedom & Prosperity’s RI-STAMP model projects by the cap that state law places on local property tax levies.*  This is an issue that the Center investigated for our testimony on the bill, last legislative session.

The most important point in response is that Dion’s insistence that municipalities would have to forgo revenue “under current law” is largely irrelevant.  Under current law, businesses must collect a 7% sales tax.  In other words, an unprecedentedly large shift in current law would be necessary in order for municipalities to see those increases, anyway.  A relatively minor addendum to allow expansion beyond the tax cap would be a simple adjustment after the fact.

The General Assembly could make that adjustment as part of the law, creating a one-time waiver of the cap for economic reasons, or it could make the adjustment during the next legislative session, when municipalities have had a chance to review their numbers for the next year’s budget.  The legislators could also develop different language depending on their priorities.  Requiring cities and towns to seek dedicated legislation for each increase would provide the greatest protection for taxpayers; allowing the Division of Municipal Finance greater leeway in granting waivers would provide significantly less protection for taxpayers, but place less burden on local officials.

Beyond the possibility of new legislation, however, Dion’s objection made no reference to the different sources of local revenue or to the allowances already in the law for exceeding the tax cap.

According to the regulations that the state Division of Municipal Finance has implemented, the tax cap applies only to the property tax levy.  Regulation 2.08 explicitly excludes “licenses and fees” and “other miscellaneous municipal revenue” from that calculation.  Removing such items from the RI-STAMP projection leaves $117.96 million of the projected increase that would actually be subject to the cap.

The same regulation also lists the various sources of state revenue that should not be counted under the cap, which includes “meals and beverage tax distributions” (representing a sales tax).  Combined with state General Law 44-5-2(d)(1), which allows a municipality to exceed the cap if it “forecasts or experiences a loss in total non-property tax revenues,” this means that the cities and towns could exceed the cap by any amount that the state reduces aid directly because of the eliminated sales tax, or any other amount that the state determines to be advisable as part of the tax reform.

RI-STAMP estimates the direct loss in sales tax revenue to municipalities at $14.41 million, which would bring the amount of the overall projected increase subject to the cap down to $103.55 million.

Additionally, under General Law 44-5-2(d)(4), a city or town can exceed the tax cap if it experiences “substantial growth in its tax base” that necessitates new or additional municipal services.  There would be some nuance, here, depending on the degree to which the growth is related to new construction, but there would likely be significant room to maneuver in the budget.

Finally, municipalities could choose, rather than exceed the cap, to pass on the benefit to residents in the form of property tax relief.  Put in budgetary terms, the cities and towns would be making tax revenue expenditures that are not subject to the tax cap, because they reduce the tax levy, rather than expand it.

Putting some numbers to the analysis, data on the Municipal Affairs Web site (collected last spring for the purposes of the Center’s testimony**) projected FY12 property tax revenue for all cities and towns at $2.1 billion.  Applying the STAMP increase that is subject to the cap to that amount suggests an increase of 5.58%.  (That’s a high estimate, because levies have grown since then.)  Assuming all cities and towns exceed the cap by the lost sales-tax revenue, the increase would be 4.90%.

The Center’s recommended approach would therefore be for Rhode Island’s cities and towns to take the windfall of a one-year increase of property taxes at the state cap, plus the amount needed to adjust for lost sales tax revenue, and then to reduce their property tax rates in order to provide the remaining $19.02 million dollars as tax relief for residents, who are still struggling to recover from the recession and subsequent lack of growth.


* These calculations assume instant implementation of Zero.Zero with the new fiscal year in July. The actual legislation submitted last year put implementation off until October, which would likely reduce the first-year property tax levy increase.

** A quick review this morning did not confirm this number, but it is presented here for illustrative purposes only.

Alternative Sales Tax Reduction Scenarios

Download report (PDF)

Notes

In November 2013, members of the Joint Legislative Commission to Study Repeal of the Rhode Island State Sales Tax requested that the Center summarize sales tax reduction scenarios, compared with the Zero.Zero plan under review.

Compliance costs for businesses, it is important to note, are not eliminated in any scenarios that do not eliminate the sales tax. The unfunded mandate of identifying, calculating, charging, collecting, reporting, and remitting sales tax revenue to the state, as well as costs for bookkeeping, accounting, and legal services, would remain.

Compliance costs would theoretically be the same with a 1% or a 7% sales tax. Furthermore, businesses would still be subject to penalty and interest charges on any past due taxes owed, maintaining an obstacle to keeping their doors open.

Highlights

The charts and table in this report display some of the more critical aspects of alternative sales tax reform scenarios. Significant findings include:

  • Sales tax reductions create the most jobs and the lowest budget “investment per job” compared with income and corporate tax reforms.
  • In all sales tax reduction scenarios except full repeal, the state will directly realize a dynamic revenue boost from increased sales volume.
  • A 0.0% sales tax rate creates the most jobs but requires the largest overall budget investment.
  • A 3.0% sales tax rate yields the most value, with the lowest state-budget investment per job and a net revenue gain, with municipalities included.
  • Phasing out the sales tax produces a similar number of jobs, but suppresses the dynamic increase in other tax revenue.

Media Release: December 2, 2013

Providence, RI — The Rhode Island Center for Freedom and Prosperity published today a new report – detailing alternative sales tax reduction scenarios – in advance of Tuesday’s hearing of the Special Joint Legislative Commission that will meet for the sixth time at the State House to evaluate repeal of the state sales tax. At the request of the Commission, the Center analyzed a number of sales tax cut options, to be compared with its original Zero.Zero plan to bring the sales tax to 0.0%. All sales tax cut scenarios will have the effect of saving money for every family and business in the state and will create thousands or tens of thousands of new jobs.

In the new report, alternative sales tax rates and phase-out options are explored; and the effect of sales tax reform is compared with other tax reforms; also. The report shows that a 3% sales tax rate would produce up to 14,000 new jobs, about 11,000 less than if the tax was eliminated, but would do so with the lowest budget investment per job.

“Because we need the jobs, our Center is still recommending complete repeal. However, the 3% scenario may be a good compromise for those concerned with the state budget”, said Mike Stenhouse, CEO for the nonpartisan Center. “Importantly, though, any partial sales tax cut scenario does not lower the cost of compliance for this unfunded mandate on the business sector”.

The report includes multiple charts and tables of the various scenarios, including a detailed jobs and revenue projection of the 3% scenario as compared with the Zero.Zero plan. Stenhouse will provide further details about the report’s findings at tomorrow’s Commission hearing.

Download report (PDF)

Rhode Island Employment Snapshot, October 2013: “Recovery” Undone

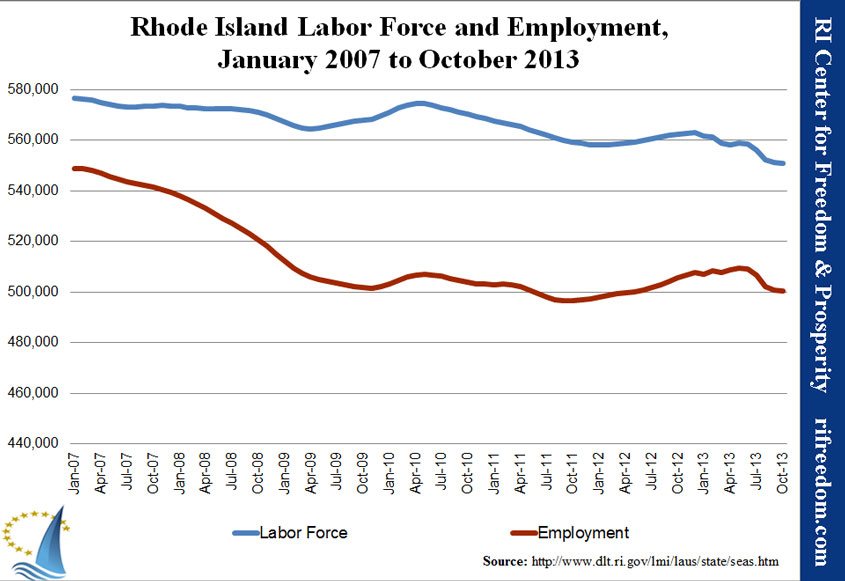
After a month of not being reported because of the government shutdown, Rhode Island’s unemployment rate moved up to 9.2% in October. According to the statistics published by the federal Bureau of Labor Statistics (BLS), 634 fewer Rhode Islanders reported being employed than did the month before (1,881 fewer than the last report, of August data), and 657 fewer people reported that they’re either working or looking for work (1,462 fewer than August).

The total employment is now down below where it was in June 2012.

As can be seen in the first chart, below, Rhode Island’s labor force (now hovering at its summer 2002 level) is only 1,874 people higher than the number of people working just before the recession started.  Rhode Island remains on track for the end of the year to have a total labor force that is lower than would be the case if all of the people who were unemployed in January 2007 completely dropped out of the labor force.

If the current employment existed with the same-sized labor force as at the beginning of the chart, the unemployment rate would be 13.2%.

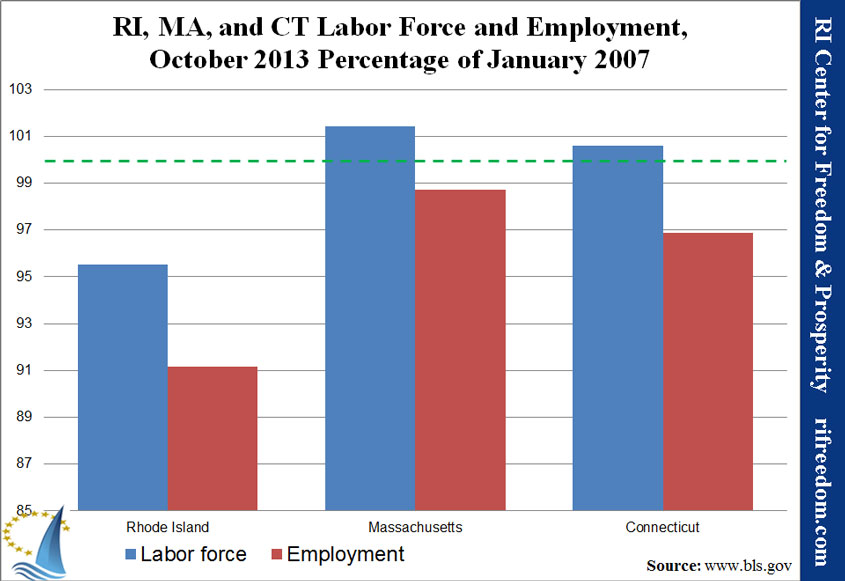
The second chart shows that the Ocean State remains well behind Massachusetts and Connecticut.  A comparison of this chart from month to month would show Rhode Island’s relative position worsening.

RI-laborforceandemp-0107-1013

RIMACT-laborforceandemp-1013perc0107