Minimum Wage’s Cost in Jobs: 432 at $8.25 and 3,466 at $10.10

Profile of minimum wage worker is NOT of a low-income, family bread-winner.

Related Links: WJAR-10 TV Story; GoLocalProv Story; Pew Research Center: national data backs up our findings; CBO – nonpartisan federal agency echos job loss projections (2014)

2014 Wall Street Journal story confirms Center’s position

Video by FEE: The Truth about the minimum wage …

As an update to prior studies of the effect of increasing the minimum wage on Rhode Island’s employment situation, the RI Center for Freedom & Prosperity estimates that proposed increases could cost the state hundreds or even thousands of jobs.

Legislation passed the General Assembly in 2014 that will increase the minimum wage in 2015 to $9.00 per hour, from its current $8.00, which was itself a new increase from $7.40 2 years ago. When all is said and done, this jump from $7.40 to $9.00 will wind up costing the state hundreds or thousands of jobs, the lion’s share affecting teenagers.

Additionally, legislators in the U.S. Congress are advocating for an increase to $10.10 per hour or higher.  That change, we estimate, would destroy 3,466 Rhode Islanders’ jobs.

Minimum Wage Changes in Rhode Island

The very next session after the Rhode Island General Assembly voted to increase the minimum wage from $7.40 to $7.75, the legislature will consider bills moving it up again, to $8.25.  The elected officials who made H5079 and S0256 among the earliest legislation to hit the State House, this year, surely see the move as a campaign to help struggling families. But the RI Center for Freedom & Prosperity sees it as a continuing assault on the state’s economy and especially those most in need of upward mobility.

Last July, the Center found that Rhode Island’s move from $6.75 to $7.40, from 2005 to 2011, likely cost teenagers in the state 397 jobs.  The increase to $7.75 destroyed an estimated 200 more.

Based on the work of the economists who performed that study, David Macpherson (Trinity University) and William Even (Miami University), with a review of the Census Bureau’s Current Population Survey for 2011 and 2012, the Center estimates that, overall, the move from $7.40 to $8.25 will eliminate 432 jobs, 204 of them among teenagers.*

Who Is Affected?

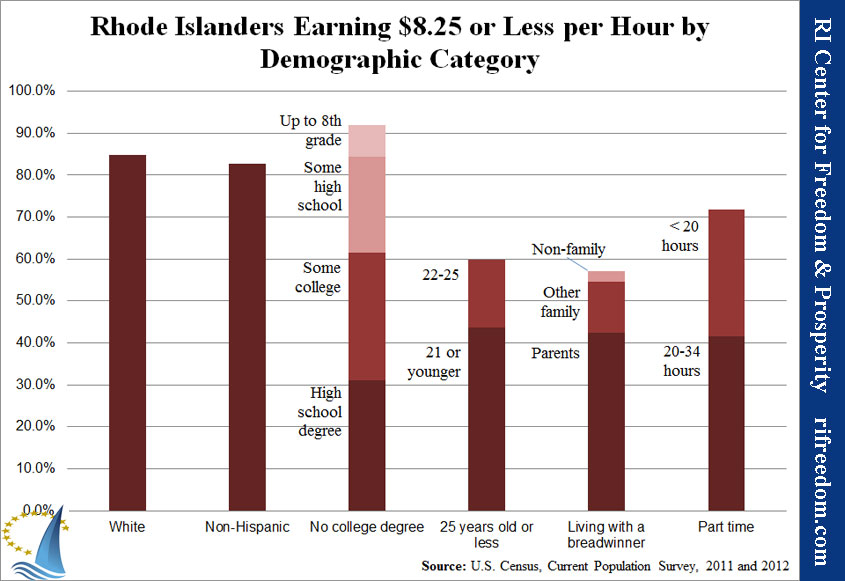
According to the study, 24,846 Rhode Islanders currently have jobs that pay them at a rate of $8.25 per hour or less.  The “typical” profile — using the highest percentage by each demographic quality — is of a white non-Hispanic high-school graduate, 21-years-old or younger and with no college experience, who lives with his or her parents and works 20-34 hours per week. The following chart shows how dominant each of these qualities is in the under-$8.25 population.

Rhode Islanders Earning $8.25 or Less per Hour by Demographic Category

Simply put, the image of low-income families struggling along at minimum wage is mostly false. The average family income of Rhode Islanders who make $8.25 per hour or less is $61,299.  For these families, the minimum-wage job provides only supplemental income. As the following table shows, even two full-time minimum-wage incomes would barely amount to half of this average.

Annual Income Earned for Different Minimum Wages by Hours Worked per Week ($)

$7.40

$7.75

$8.25

20 hours

7,696

8,060

8,580

34 hours

13,083

13,702

14,586

40 hours

15,392

16,120

17,160

Notes: The percentages of minimum-wage-earning Rhode Islanders in each hours category is as follows:

  • Fewer than 20 hours: 30.2%
  • 20 to 34 hours: 41.6%
  • 35 or more hours: 28.2%

Results assume 52 weeks of work per year.

Source: U.S. Census, Current Population Survey, 2011 and 2012

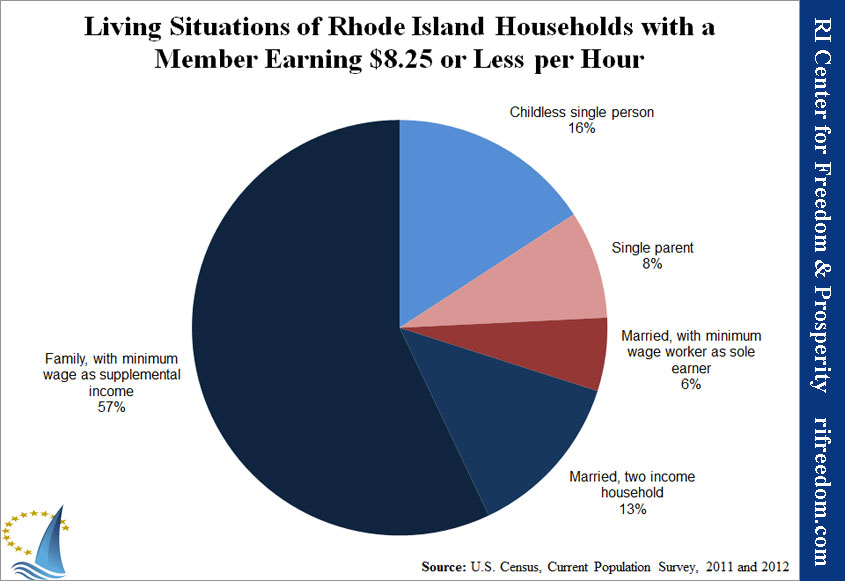
The following chart illustrates that only a small minority of families rely entirely on a minimum wage income for support, even among households with some minimum-wage income.

Living Situations of Rhode Island Households with a Member Earning $8.25 or Less per Hour

What’s the Effect?

We estimate that the increase of the minimum wage from $7.40 to $8.25 per hour will result in a loss of 432 minimum wage jobs in Rhode Island. This total assumes a lower effect on better educated and older workers.  That’s a 1.74% reduction of employment available to people currently earning less than $8.25. Of those losing jobs, 204 will be teenagers.

The focus of advocates for higher minimum wages is very often on the plight of people striving to live on such low salaries, but most workers at that pay rate do not fit the profile.  Most of them are bringing in relatively small amounts of supplemental income — many as discretionary spending cash for teens and young adults who are still largely supported by their parents.

In the view of the RI Center for Freedom & Prosperity, the loss of employment opportunities for Rhode Islanders in this group outweighs the relatively small increases in take-home pay.  At young adults’ formative age, the connections, habits, and general experience that come from working at any pay scale are vastly more valuable than the small increases that legislators are able to mandate through minimum wage laws.

At the National Level, a Bigger Hammer

This morning, Rhode Island’s two representatives in the U.S. Congress, Jim Langevin (D) and David Cicilline (D), jointly announced their support for the “Fair Minimum Wage Act.” The act would increase the federal minimum wage — and, therefore, Rhode Island’s minimum wage — to $10.10 per hour.

The RI Center for Freedom & Prosperity estimates that this move would result in a loss of 3,466 jobs for Rhode Islanders, or 4.1% of the total number who currently work at or below that rate of pay.  Moreover, even with this broader net, the number of affected families that are subsisting on minimum wage income alone would still be just 17% of all households with at least one member earning that amount.


* Going back to the prior minimum wage rate of $7.40 was necessary because measuring the change from the current rate of $7.75 to $8.25 produced insufficient sample sizes.

Second-Year Report Card: Lack of Bold Action = Lack of Improvement

Related Links: 2012 Report Card

It isn’t surprising that a year of no bold legislative or executive action to free the Rhode Island economy or education system from its shackles, or to lighten the heavy hand of government, was a year of no significant improvement in the RI Center for Freedom & Prosperity’s annual Report Card on RI Competitiveness.

What changes the Ocean State saw in the report card’s ten major categories came in large part due to changes of the subcategories, a technical change in the Center’s methodology, and tiny shifts that were able to cross a line into a new letter grade.  In 2012, Rhode Island had five grades of F, two of D-, two of D, and one of D+. In 2013, the tally is three of F, four of D-, one of D, and two of D+. (One of the lost Fs was purely a change in the method of ranking states.)

The sheer number of below-average grades does much to explain Rhode Island’s continuing economic decline and population exodus.

“For all the talk last year about the positive legislative steps we supposedly took, the state’s dismal grade point average has barely moved”, said the Center’s CEO, Mike Stenhouse. “We’ve all seen the depressing headlines, but when compiled into a single report, the report card shows how poor public policy is strangling economic opportunities for families in our state.”

The report card organizes 53 national rankings into the following major categories:

  • Tax Burden (D-)
  • Business Climate (F)
  • Spending & Debt (D-)
  • Employment & Income (D-)
  • K-12 Education (D+)
  • Energy (D+)
  • Infrastructure (F)
  • Public Sector (D)
  • Health Care (D-)
  • Living & Retiring in RI (F)

Whether the decision is thoroughly researched or simply based on impressions, these are the categories on which the Ocean State is judged when businesses and individuals make important decisions about their lives and their economic well-being. Having the information all in one place may be discouraging, but it gives those with a vested interest in the health of the State of Rhode Island clear guidelines for what problems must be addressed.

Concluding a Strange Season for Employment Data

For the final month of the year, the “headline” unemployment number, which is the percentage of people in the labor force who say they are actively seeking work, held at 7.8%. Two frequently highlighted considerations are that, one, certain demographic groups are way above that percentage and, two, the rate would be significantly higher if the American labor force hadn’t slowed its pace. If the labor force of the last five years had continued to grow at the rate of the prior five years, the unemployment rate would be 8.6%.

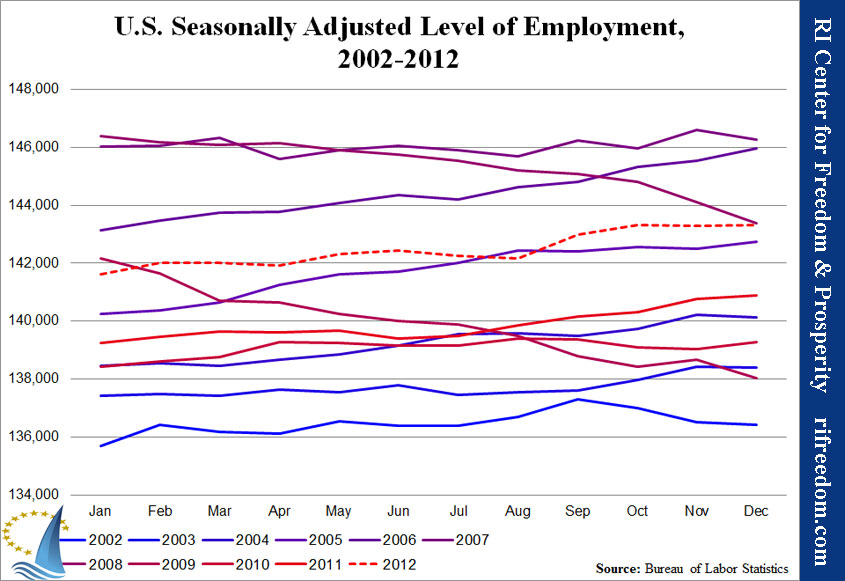
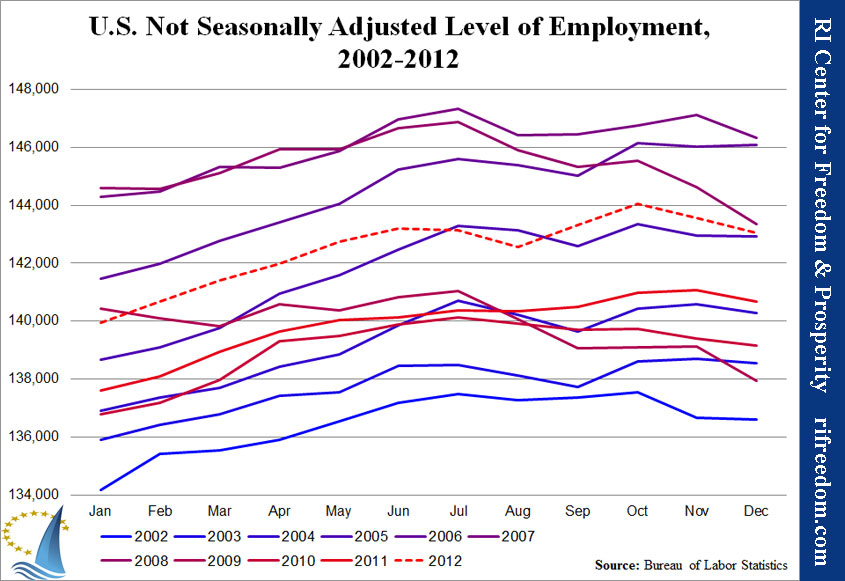
Each of the following charts shows the monthly number of Americans who say that they are currently employed. The bluer the line, the older the data; the redder the line, the newer the data. The dashed line is 2012. The first chart shows the data seasonally adjusted, which is the more common way of reporting the numbers; the second chart shows them without the adjustment.

U.S. Seasonally Adjusted Level of Employment, 2002-2012

U.S. Not Seasonally Adjusted Level of Employment, 2002-2012


The seasonally adjusted story of 2012 is utter stagnation with a big, unusual upswing from August to October. Without the seasonal adjustment, the story is a typical increase in employment for the first half of the year and late-summer down-slide followed by an unusually large and consistent spike in October, the month before the election.

Regarding the seasonally adjusted chart, the end of year change in past numbers — which a BLS spokesman tells me happens every year, always addressing the previous five years — reduced the big autumn jump by 9.3%. That is, the seasonal adjustment for the months leading up to September raised the line up, while the peak in October shifted down and the next month, November, increased a bit. (For some reason, September’s number didn’t change at all.)

So, in the “raw” unadjusted numbers, we see a strange jump, which the seasonal adjustment de-emphasized, and the revised numbers de-emphasized it further. But if you’re thinking that it would be interesting to see how all these lines develop over the coming year, you’re out of luck. This is from the BLS news release, this morning (emphasis added):

Effective with the release of The Employment Situation for January 2013, scheduled for February 1, 2013, new population controls will be used in the monthly household survey estimation process. These new controls reflect the annual updating of intercensal population estimates by the U.S. Census Bureau. Historical data will not be revised to incorporate the new controls; consequently, household survey data for January 2013 will not be directly comparable with that for December 2012 or earlier periods. A table showing the effects of the new controls on the major labor force series will be included in the January 2013 release.

It will certainly be interesting to see which way the new methodology shifts the numbers.

Rhode Island Employment Snapshot, November 2012

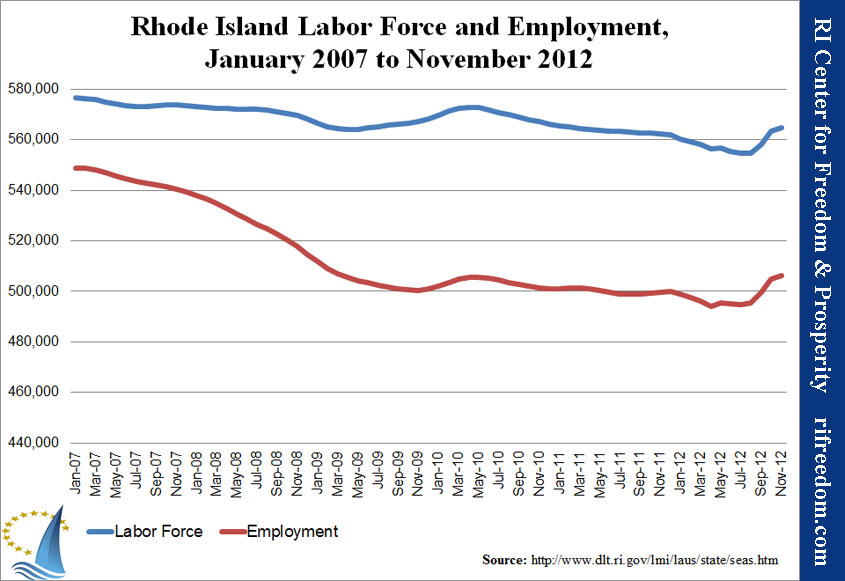
Rhode Island’s unemployment rate stopped its incremental improvement in November, marking the first month since April that it didn’t fall.  However, for most of that period, the drop was attributable to the fact that more people were leaving the labor force than losing their employment.  In November, by contrast, the steady rate results from a labor force increase that was nearly as large as the employment increase.

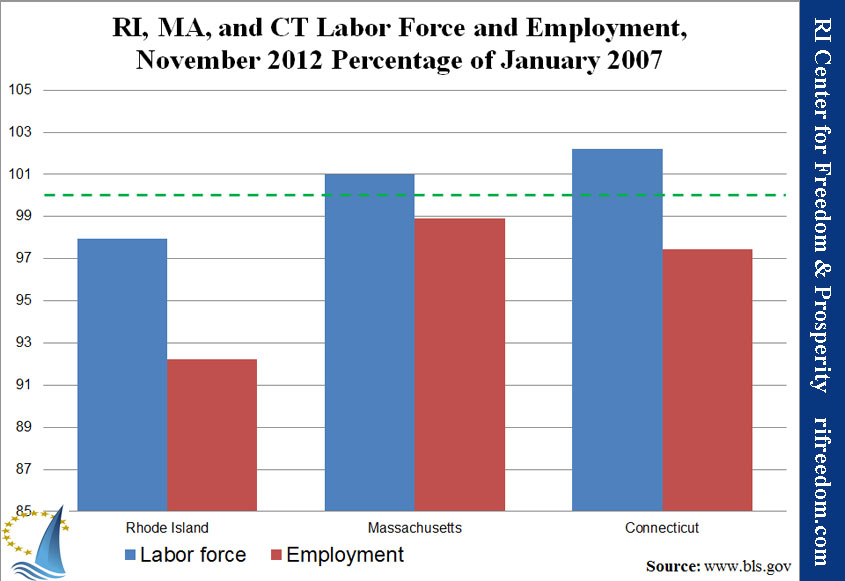
That said, the first chart that follows shows that the unusually large gains by both metrics — which placed Rhode Island inexplicably at the head of the nation for employment gains —lost steam in November.  Meanwhile, the Ocean State remains well behind its January 2007 numbers — still significantly behind both Massachusetts and Connecticut, despite several months of employment free fall in Connecticut.

Nationwide, Rhode Island is one of the two remaining states with unemployment rates above 10%, with the other, Nevada, rapidly making up the ground between them.

Rhode Island Labor Force and Employment, January 2007 to November 2012

RI, MA, and CT Labor Force and Employment, November 2012 Percentage of January 2007

Press Release: Public vs. Private Sector Compensation in RI

Press Release
Public vs Private Sector Compensation in RI

High-Pay Government Workers Supported by Low-Pay Private Workers

FOR IMMEDIATE RELEASE

November 28, 2012

Government workers in the Ocean State collect significantly higher compensation than their private sector counterparts – across the board – according to data recently compiled as part of national study for the RI Center for Freedom & Prosperity, a non-partisan local think tank.
Among the findings in the report published today by the Center, Ocean State public sector employees enjoy compensation levels that are 26.5% higher than their private sector counterparts; a rate 41% higher than the New England average and 78% higher than the national norm. These results were calculated via a statistical regression analysis after controlling for factors such as education and experience. On average RI government workers receive 58% more in ‘benefits’ than private workers in RI.

Further, within the New England region, RI public employees: are unique in collecting a higher “base” pay than private employees; work the fewest total hours; receive a higher paid time off value than in the private sector; and benefit from a 41% higher total compensation premium than the regional average.
“Rhode Islanders want a government that works for all citizens. But it may not be so much that state and municipal employees are grossly overpaid, but more that our state’s private sector has such shockingly low compensation levels,” said Mike Stenhouse, CEO for the Center. “This is yet another clear indication of how public policy in the Ocean State has favored certain groups while severely harming our economy and our business sector.”
According to the study conducted by economists William Even, of Miami University, and David Macpherson, of Trinity University, government workers in RI, on average, collect $100,217 in total compensation as compared with $83,419 for private employees. Respectively, base-pay breaks out to $61,046 vs $58,664, with benefits at $39,171 vs $24,755. A preliminary review of the effects of the state’s 2011 pension reform showed its effect to be negligible on these comparisons.
The data raises serious questions about the sustainability of a system where a low-pay private sector is supporting a high-pay public sector. “Are we heading towards a Central Falls type situation where pension benefits have to be cut dramatically, or even worse, a Scranton, PA situation where city worker pay was cut to minimum wage”, inquired Stenhouse. “It is evident that new policies that promote economic growth and increase our tax base are the best way to ensure that we can afford to maintain current public employee compensation levels”, concluded Stenhouse.
The full report, with additional data, tables, analysis, and methodology can be found at http://www.rifreedom.org/2012/11/ri-public-and-private-sector-compensation-comparison/.
The Rhode Island Center for Freedom and Prosperity, a non-partisan public policy think tank, is the state’s leading free-enterprise advocacy organization. With a credo that freedom is indispensable to citizens’ well-being and prosperity, the Center’s mission is to stimulate a rigorous exchange of ideas with the goal of restoring competitiveness to Rhode Island through the advancement of market-based reform solutions.

Media Contact:
Mike Stenhouse: 401.429.6115, info@rifreedom.org

Rhode Island Labor Force and Employment, January 2007 to October 2012

Rhode Island Employment Snapshot, October 2012

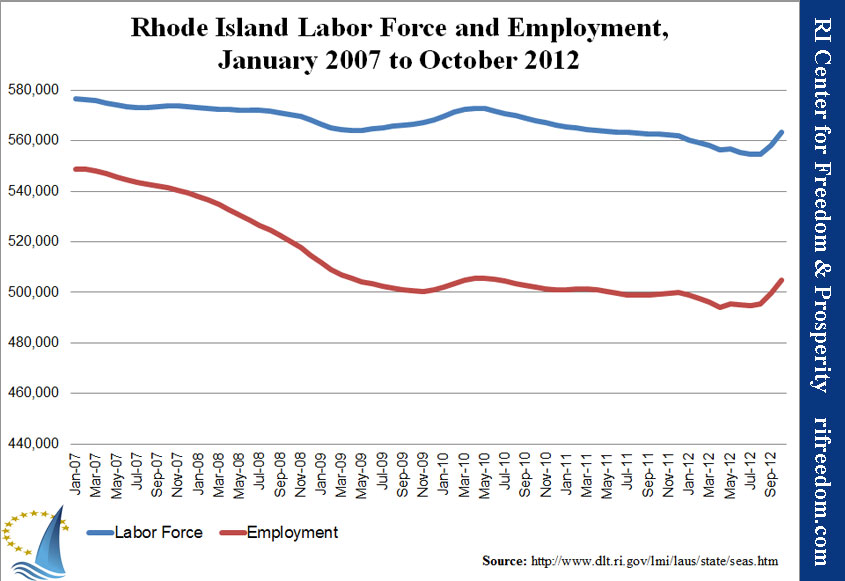
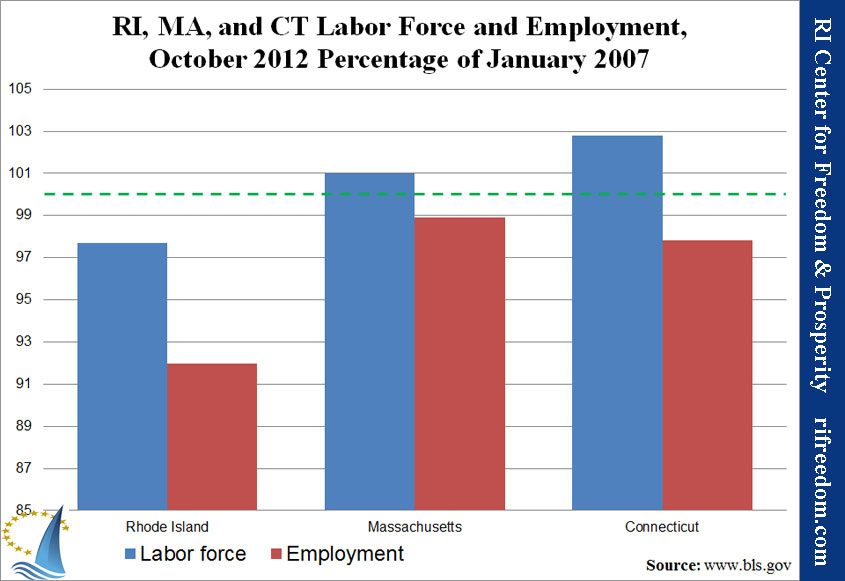
Rhode Island’s unemployment rate fell one tenth of a point in October, to 10.4%, still second worst in the nation, after Nevada. However, for the second month in a row, the Ocean State led the nation in actual employment increase. While the data offers an encouraging picture, the boom in jobs over the past two months has been so historically large that it ought to be treated with caution until other economic indicators begin to substantiate the results.

The first chart below shows Rhode Island’s trends in labor force (employed and looking for work) and employment since the beginning of the recession in January 2007. The second chart shows the labor force and employment pictures for Rhode Island, Massachusetts, and Connecticut as each state’s current percentage of January 2007.

Rhode Island Labor Force and Employment, January 2007 to October 2012


RI, MA, and CT Labor Force and Employment, October 2012 Percentage of January 2007

Minimum Wage Hike Will Cause Loss of 200 Teen Jobs in RI

Watch this video by LearnLiberty.org to see how increasing the minimum wage increases unemployment among low-skilled workers

On the heels of a national report that painted a bleak employment picture for teens, the Rhode Island Center for Freedom and Prosperity issued a policy note today that shows that the Rhode Island General Assembly has made the teen jobs situation even worse in the Ocean State when it raised the state minimum wage by 35 cents to $7.75.

 According to updated data made available to the Center from an earlier study(i) by nationally recognized economists, Rhode Island teens are projected to see 200 fewer jobs this year as a result of the minimum wage hike. This loss, 1% of teens employed in 2011, will hit especially hard on those who do not have high school degrees; this group is expected to suffer 75% of the anticipated loss.

Rhode Island’s teen unemployment rate in 2011 (28.3%) is already 3.4 percentage points higher than the national average of 24.9%. The minimum wage increase will make this discrepancy even worse.

The data, which will be part of a more comprehensive teen employment report the Center plans to release in July, is “yet another example of the death-by-a-thousand-cuts syndrome that is depressing our state’s growth,” said Mike Stenhouse, CEO for the Center. Continual small increases in taxes and regulations are often implemented for compassionate reasons, but it is the contention of the Center that the cumulative effect of these polices has been devastating for area businesses, for the state’s economy, and especially for those seeking work.

“Imagine that because of this minimum wage increase two hundred more Rhode Island teens are not going to have the chance to earn a paycheck, to learn important business skills, or to build their personal résumés,” concluded Stenhouse.

(i) “Update of Evan and Macpherson, 2010.” Economists David Macpherson (Trinity University) and William Even (Miami University) released a study in 2010 that examined the impact of the federal minimum wage increase between 2007 and 2009. 
 
Media Coverage:
6/19/2012: Prov. Business News, Minimum Wage Bump Will Cost 200 Jobs
6/19/2012: GoLocalProv, Minimum Wage Hike Will Cost 200 Teen Jobs, Group Says