Rhode Island Employment Snapshot, December 2013: RI Alone

The bleakest aspect of the latest employment report from the national Bureau of Labor Statistics (BLS) is that Rhode Island is now all alone in last place.  Whereas the Ocean State moved from 9.0% unemployment to 9.1% unemployment, Nevada dropped from the same level to 8.8%.  Rhode Island is now 0.3 percentage points behind any other state in the country.

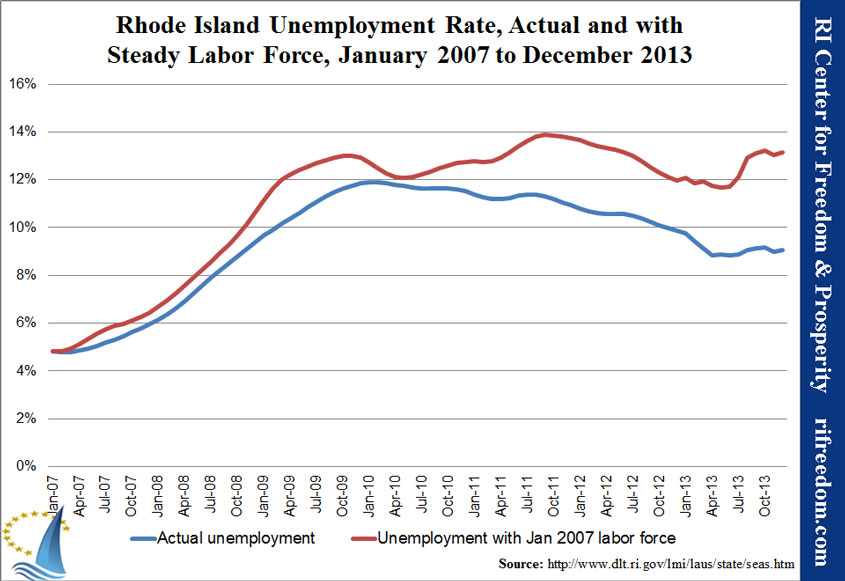
The next-bleakest aspect is that, had Rhode Island not lost so many people from its labor force — that is, if so many people had not decided to stop looking for work or had they been replaced in the workforce by somebody else — our unemployment rate would have ticked up to 13.2%

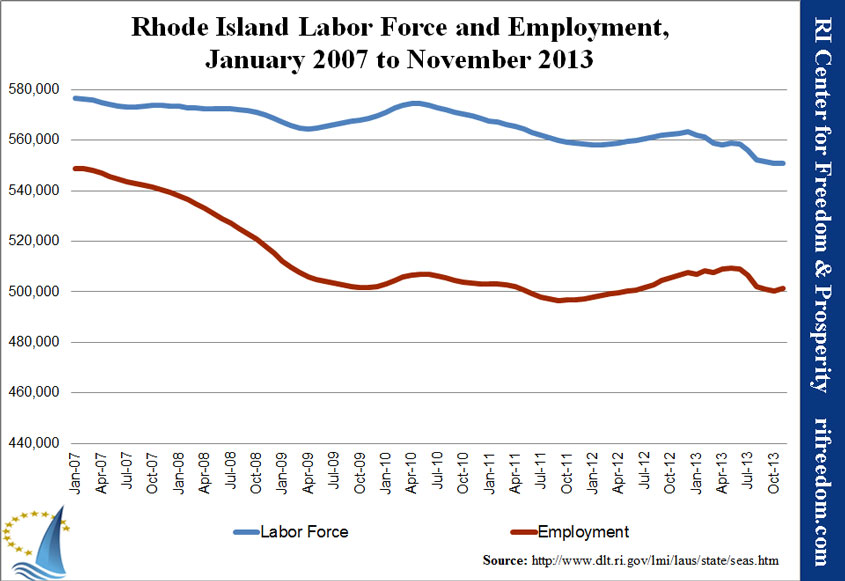
According to the statistics published by the BLS, 680 fewer Rhode Islanders reported being employed than did the month before, and 296 fewer people reported that they’re either working or looking for work.

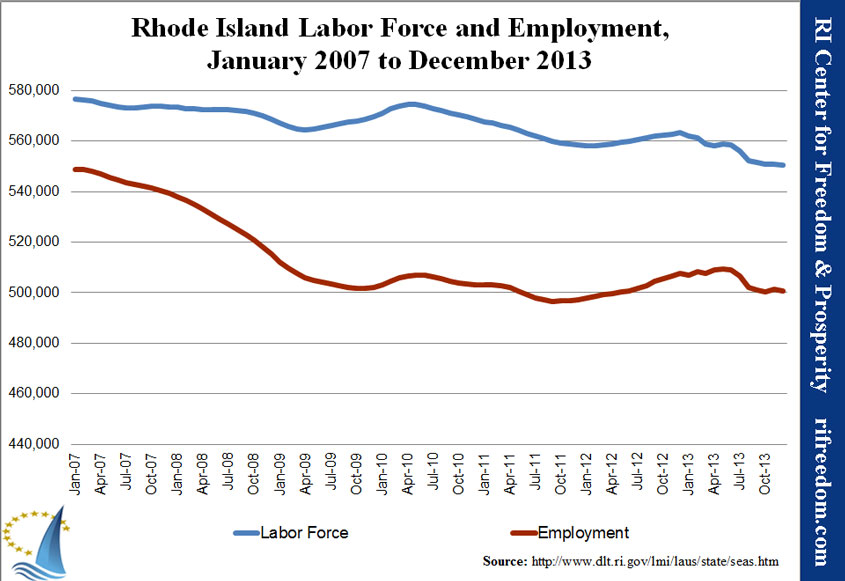
As the first chart below illustrates, the downward drift of the labor force continues unabated, and November’s increase in employment now looks like the aberration.

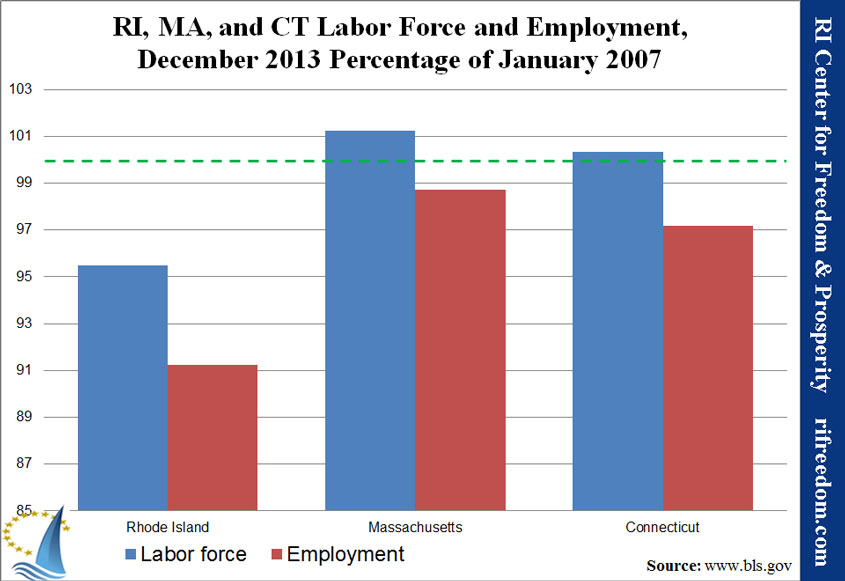
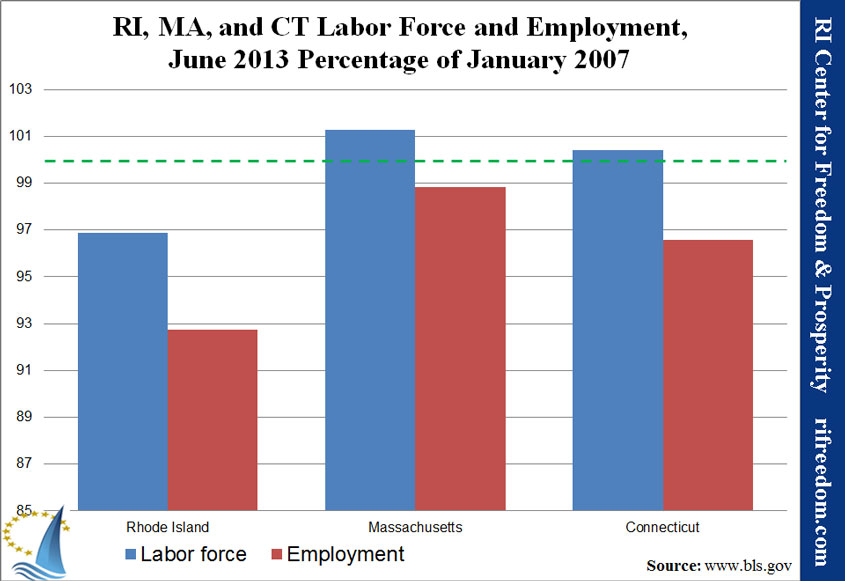
The second chart gives a view of the state’s great distance from peak employment.  Both of our neighbors, Massachusetts and Connecticut have seen labor force increases since the beginning of the jobs recession, and both have maintained significantly higher employment

The third chart is new, this month, and compares Rhode Island’s unemployment rate with what it would have been if the state’s labor force had held steady.  The chart makes clear that the Ocean State’s unemployment rate would have been much higher, over the past few years, had people not given up looking for work… almost reaching 14% in 2011.  It also emphasizes the disturbing trend that the only reason the unemployment rate seems to have been stagnant, rather than increasing, throughout 2013 is that fewer Rhode Islanders are counted at all.

RI-laborforceandemp-0107-1213

RIMACT-laborforceandemp-1213perc0107

RI-unemploymentrate-steadyLF-0107-1213

Rhode Island: A Growing Population in an Abysmal Economy

The U.S. Census is out, today, with updated estimates for the populations of each state.  The real telling data will come next month, when the Census releases the more detailed results about immigration, births, deaths, and age brackets.

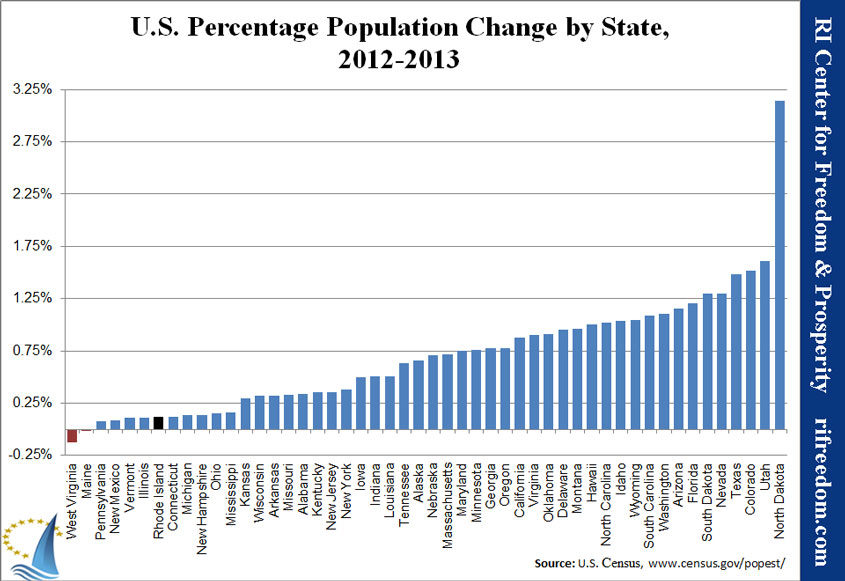
Nonetheless, the buzz has begun, because 2013’s small population increase follows eight years during which Rhode Island’s population declined; this decade, it was the only state to have that result twice in a row.  That potentially positive result comes with some important caveats, however.

The Census changed methodologies, this year.  Because the change applied evenly across the states, there isn’t any obvious reason why it should have affected the Ocean State differently.  On the other hand, if it turns out that the agency captured a particular group more precisely and Rhode Island’s peculiarities make that group more significant, it could have made the numbers not entirely comparable from year to year.

The Ocean State is still estimated to be below its 2010 Census count.  In fact, it’s one of only two states of which that’s true, and is many times worse off than Maine, which barely edged into the category this year.

Rhode Island is still in the bottom 10, with year-over-year growth one-seventh the size of the national average. Our economy, our retirement systems, and our social institutions rely to some extent on a certain amount of growth.  In that regard, growth below that amount is tantamount to a decrease in its effect.

Policy differences make it telling which states are on the other end of the rankings.  One reason that state population growth rankings are an important indicator is that it gives some idea which sorts of policies attract immigrants, give retirees a reason to stay put, and make young families optimistic enough to have babies.  The following chart shows the states ranked by their year-over-year percentage increases.

USstates-popchange-2012-2013

A growing population isn’t necessarily a good thing in conjunction with other data. Every month, we’ve tracked the shrinking of Rhode Island’s labor force; that’s the total number of Rhode Islanders who are either working or actively looking for work.  If Rhode Island’s population is growing but fewer people are participating in the state’s workforce, then there are more people who aren’t contributing to the state’s economic output. There are also potentially more people who are taking advantage of government programs, for which money must be taken out of the economy.

The population casts a dark light on Rhode Island’s unemployment rate. For November, Rhode Island was tied with Nevada for the worst unemployment rate in the country.  The unemployment rate is the percentage of people who are counted within the labor force and who say that they are not employed.  In stark contrast to Rhode Island, Nevada is on the right side of the above chart, indicating that its population is growing relatively quickly.  In other words, Nevada’s unemployment rate is more an indication that it’s having to find work for a growing number of people; that’s a much more optimistic way to be tied for last place in unemployment than Rhode Island’s perpetual stagnation and decline.

Rhode Island Employment Snapshot, November 2013: Tied for Last

Rhode Island’s unemployment rate fell to 9.0% in November, but that wasn’t enough to keep the state from falling to status as tied for worst.  According to the statistics published by the federal Bureau of Labor Statistics (BLS), 1,044 more Rhode Islanders reported being employed than did the month before, and 130 more people reported that they’re either working or looking for work.

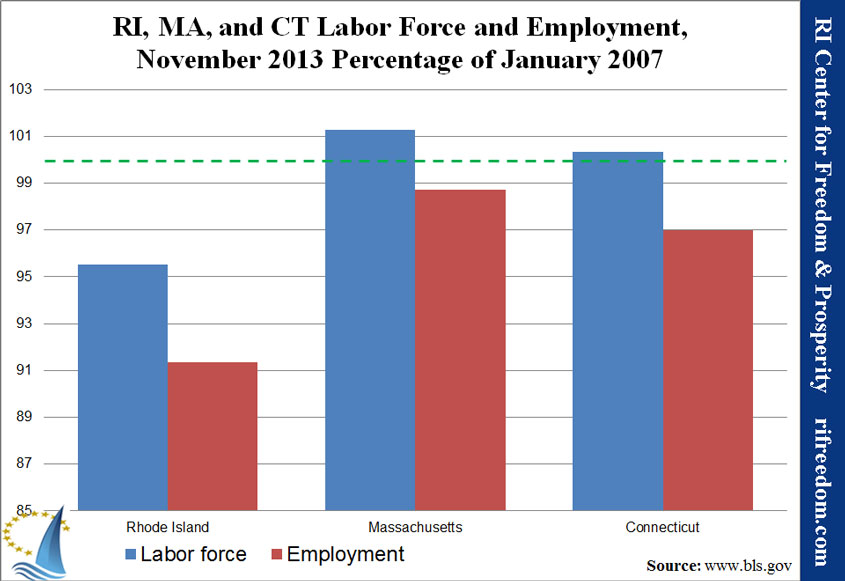
As the first chart below illustrates, the state has gotten at least a one-month reprieve from its precipitous drop in employment, which may keep the Ocean State from crossing some worrisome thresholds before the end of the year, such as having fewer people in the labor force than were employed in January 2007.

The second post gives a view of the state’s small improvements in the context of its great distance from peak employment.

RI-laborforceandemp-0107-1113

RIMACT-laborforceandemp-1113perc0107

Zero.Zero and the Municipal Property Tax Cap

At last night’s meeting of the Special Joint Legislative Commission to Study the Sales Tax Repeal Act of 2013, Director of Revenue Analysis in the Rhode Island Department of Revenue Paul Dion stated that municipalities would be prevented from realizing the increase in local revenue that the RI Center for Freedom & Prosperity’s RI-STAMP model projects by the cap that state law places on local property tax levies.*  This is an issue that the Center investigated for our testimony on the bill, last legislative session.

The most important point in response is that Dion’s insistence that municipalities would have to forgo revenue “under current law” is largely irrelevant.  Under current law, businesses must collect a 7% sales tax.  In other words, an unprecedentedly large shift in current law would be necessary in order for municipalities to see those increases, anyway.  A relatively minor addendum to allow expansion beyond the tax cap would be a simple adjustment after the fact.

The General Assembly could make that adjustment as part of the law, creating a one-time waiver of the cap for economic reasons, or it could make the adjustment during the next legislative session, when municipalities have had a chance to review their numbers for the next year’s budget.  The legislators could also develop different language depending on their priorities.  Requiring cities and towns to seek dedicated legislation for each increase would provide the greatest protection for taxpayers; allowing the Division of Municipal Finance greater leeway in granting waivers would provide significantly less protection for taxpayers, but place less burden on local officials.

Beyond the possibility of new legislation, however, Dion’s objection made no reference to the different sources of local revenue or to the allowances already in the law for exceeding the tax cap.

According to the regulations that the state Division of Municipal Finance has implemented, the tax cap applies only to the property tax levy.  Regulation 2.08 explicitly excludes “licenses and fees” and “other miscellaneous municipal revenue” from that calculation.  Removing such items from the RI-STAMP projection leaves $117.96 million of the projected increase that would actually be subject to the cap.

The same regulation also lists the various sources of state revenue that should not be counted under the cap, which includes “meals and beverage tax distributions” (representing a sales tax).  Combined with state General Law 44-5-2(d)(1), which allows a municipality to exceed the cap if it “forecasts or experiences a loss in total non-property tax revenues,” this means that the cities and towns could exceed the cap by any amount that the state reduces aid directly because of the eliminated sales tax, or any other amount that the state determines to be advisable as part of the tax reform.

RI-STAMP estimates the direct loss in sales tax revenue to municipalities at $14.41 million, which would bring the amount of the overall projected increase subject to the cap down to $103.55 million.

Additionally, under General Law 44-5-2(d)(4), a city or town can exceed the tax cap if it experiences “substantial growth in its tax base” that necessitates new or additional municipal services.  There would be some nuance, here, depending on the degree to which the growth is related to new construction, but there would likely be significant room to maneuver in the budget.

Finally, municipalities could choose, rather than exceed the cap, to pass on the benefit to residents in the form of property tax relief.  Put in budgetary terms, the cities and towns would be making tax revenue expenditures that are not subject to the tax cap, because they reduce the tax levy, rather than expand it.

Putting some numbers to the analysis, data on the Municipal Affairs Web site (collected last spring for the purposes of the Center’s testimony**) projected FY12 property tax revenue for all cities and towns at $2.1 billion.  Applying the STAMP increase that is subject to the cap to that amount suggests an increase of 5.58%.  (That’s a high estimate, because levies have grown since then.)  Assuming all cities and towns exceed the cap by the lost sales-tax revenue, the increase would be 4.90%.

The Center’s recommended approach would therefore be for Rhode Island’s cities and towns to take the windfall of a one-year increase of property taxes at the state cap, plus the amount needed to adjust for lost sales tax revenue, and then to reduce their property tax rates in order to provide the remaining $19.02 million dollars as tax relief for residents, who are still struggling to recover from the recession and subsequent lack of growth.


* These calculations assume instant implementation of Zero.Zero with the new fiscal year in July. The actual legislation submitted last year put implementation off until October, which would likely reduce the first-year property tax levy increase.

** A quick review this morning did not confirm this number, but it is presented here for illustrative purposes only.

Alternative Sales Tax Reduction Scenarios

Download report (PDF)

Notes

In November 2013, members of the Joint Legislative Commission to Study Repeal of the Rhode Island State Sales Tax requested that the Center summarize sales tax reduction scenarios, compared with the Zero.Zero plan under review.

Compliance costs for businesses, it is important to note, are not eliminated in any scenarios that do not eliminate the sales tax. The unfunded mandate of identifying, calculating, charging, collecting, reporting, and remitting sales tax revenue to the state, as well as costs for bookkeeping, accounting, and legal services, would remain.

Compliance costs would theoretically be the same with a 1% or a 7% sales tax. Furthermore, businesses would still be subject to penalty and interest charges on any past due taxes owed, maintaining an obstacle to keeping their doors open.

Highlights

The charts and table in this report display some of the more critical aspects of alternative sales tax reform scenarios. Significant findings include:

  • Sales tax reductions create the most jobs and the lowest budget “investment per job” compared with income and corporate tax reforms.
  • In all sales tax reduction scenarios except full repeal, the state will directly realize a dynamic revenue boost from increased sales volume.
  • A 0.0% sales tax rate creates the most jobs but requires the largest overall budget investment.
  • A 3.0% sales tax rate yields the most value, with the lowest state-budget investment per job and a net revenue gain, with municipalities included.
  • Phasing out the sales tax produces a similar number of jobs, but suppresses the dynamic increase in other tax revenue.

Media Release: December 2, 2013

Providence, RI — The Rhode Island Center for Freedom and Prosperity published today a new report – detailing alternative sales tax reduction scenarios – in advance of Tuesday’s hearing of the Special Joint Legislative Commission that will meet for the sixth time at the State House to evaluate repeal of the state sales tax. At the request of the Commission, the Center analyzed a number of sales tax cut options, to be compared with its original Zero.Zero plan to bring the sales tax to 0.0%. All sales tax cut scenarios will have the effect of saving money for every family and business in the state and will create thousands or tens of thousands of new jobs.

In the new report, alternative sales tax rates and phase-out options are explored; and the effect of sales tax reform is compared with other tax reforms; also. The report shows that a 3% sales tax rate would produce up to 14,000 new jobs, about 11,000 less than if the tax was eliminated, but would do so with the lowest budget investment per job.

“Because we need the jobs, our Center is still recommending complete repeal. However, the 3% scenario may be a good compromise for those concerned with the state budget”, said Mike Stenhouse, CEO for the nonpartisan Center. “Importantly, though, any partial sales tax cut scenario does not lower the cost of compliance for this unfunded mandate on the business sector”.

The report includes multiple charts and tables of the various scenarios, including a detailed jobs and revenue projection of the 3% scenario as compared with the Zero.Zero plan. Stenhouse will provide further details about the report’s findings at tomorrow’s Commission hearing.

Download report (PDF)

Rhode Island Employment Snapshot, October 2013: “Recovery” Undone

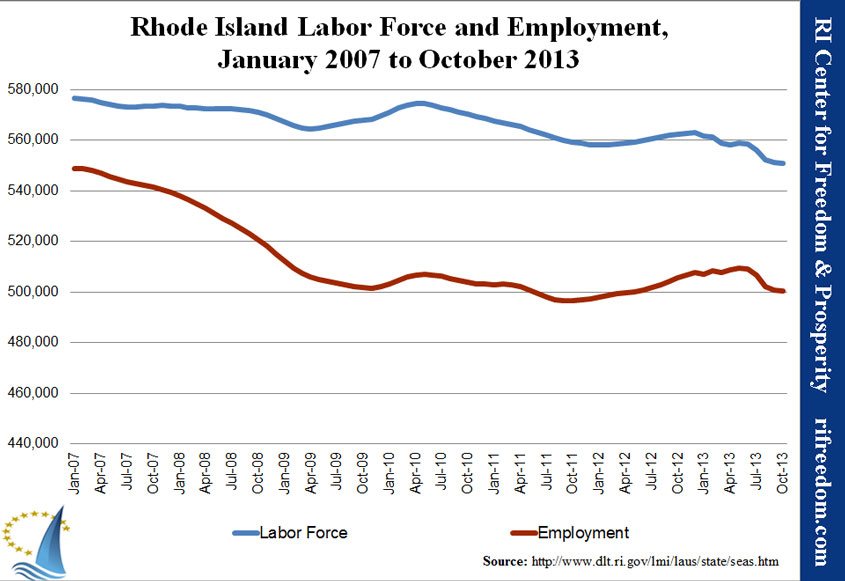
After a month of not being reported because of the government shutdown, Rhode Island’s unemployment rate moved up to 9.2% in October. According to the statistics published by the federal Bureau of Labor Statistics (BLS), 634 fewer Rhode Islanders reported being employed than did the month before (1,881 fewer than the last report, of August data), and 657 fewer people reported that they’re either working or looking for work (1,462 fewer than August).

The total employment is now down below where it was in June 2012.

As can be seen in the first chart, below, Rhode Island’s labor force (now hovering at its summer 2002 level) is only 1,874 people higher than the number of people working just before the recession started.  Rhode Island remains on track for the end of the year to have a total labor force that is lower than would be the case if all of the people who were unemployed in January 2007 completely dropped out of the labor force.

If the current employment existed with the same-sized labor force as at the beginning of the chart, the unemployment rate would be 13.2%.

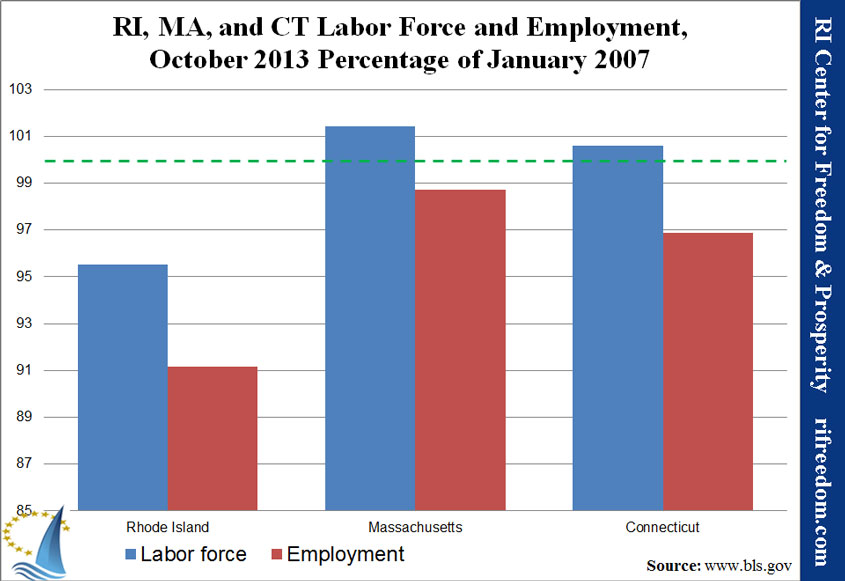
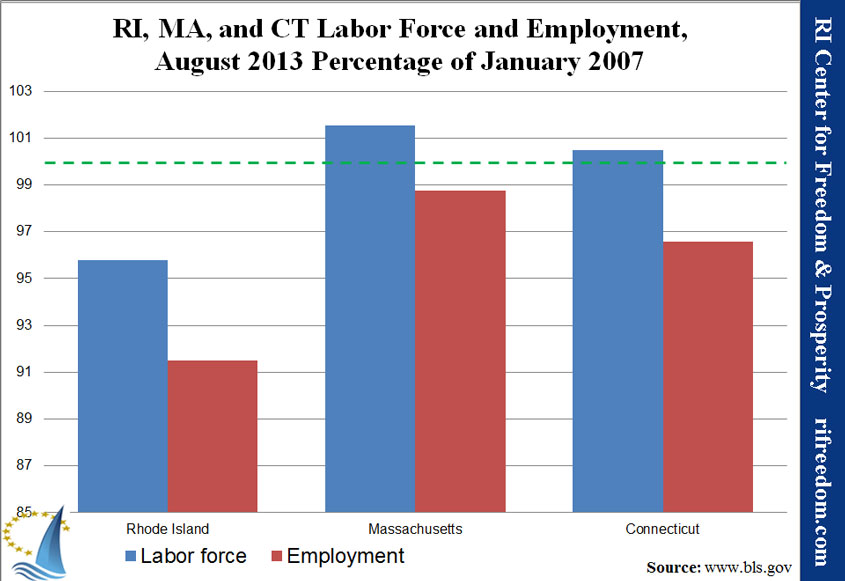
The second chart shows that the Ocean State remains well behind Massachusetts and Connecticut.  A comparison of this chart from month to month would show Rhode Island’s relative position worsening.

RI-laborforceandemp-0107-1013

RIMACT-laborforceandemp-1013perc0107

Rhode Island Employment Snapshot, August 2013: Needle Keeps Moving

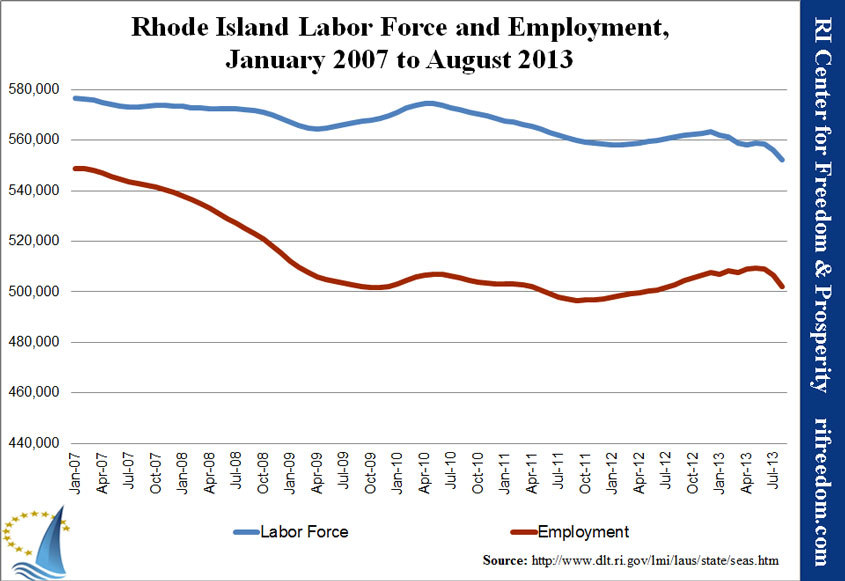
Leading the country in the percentage drop of people who say that they are employed, Rhode Island’s unemployment rate skipped to 9.1% in August. According to the statistics published by the federal Bureau of Labor Statistics (BLS), 4,469 fewer Rhode Islanders reported being employed than did the month before, and 3,729 fewer people reported that they’re either working or looking for work.

If the second number (the “labor force”) had remained the same, August’s unemployment rate would have been 9.7%. August nearly reduced all employment gains in Rhode Island over the past year.

As can be seen in the first chart, below, Rhode Island’s labor force (which hasn’t been this small since August 2002) is only 3,395 people higher than the number of people working just before the recession started.  Another drop like August’s will mean that about the same number of people who were unemployed in January 2007 have since completely dropped out of the labor force.

If the current employment existed with the same-sized labor force as at the beginning of the chart, the unemployment rate would be 12.9%.

The second chart shows that the Ocean State remains well behind Massachusetts and Connecticut.  A comparison of this chart from month to month would show Rhode Island’s relative position worsening.

RI-laborforceandemp-0107-0813

RIMACT-laborforceandemp-0813perc0107

Rhode Island Employment Snapshot, July 2013: The Big Drop

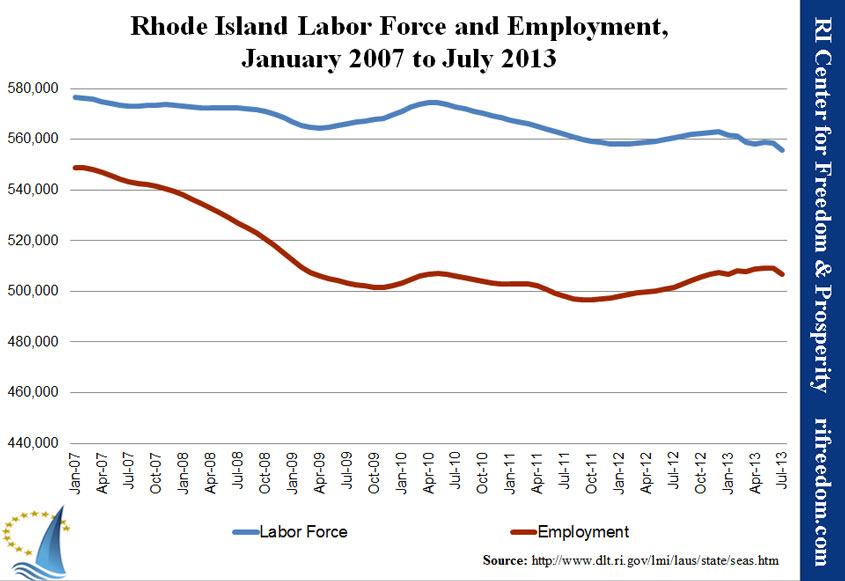
Rhode Island’s relatively steady unemployment rate for July, at 8.9%, is highly misleading.  According to the statistics published by the federal Bureau of Labor Statistics (BLS), 2,379 fewer Rhode Islanders reported being employed than did the month before, but 2,538 fewer people reported that they’re either working or looking for work, so the official unemployment rate held relatively steady. July erased all of the state’s miniscule monthly gains back to last October and brought the labor force back to its early-2005 level.

The first chart below shows how dramatic July’s drop was.  Although all but four states in the entire country saw employment decreases, Rhode Island’s drop was seventh steepest.  In New England, Rhode Island’s decline was orders of magnitude greater than the other states’, which mainly held steady.  Connecticut was one of the four states in the country that saw an increase.

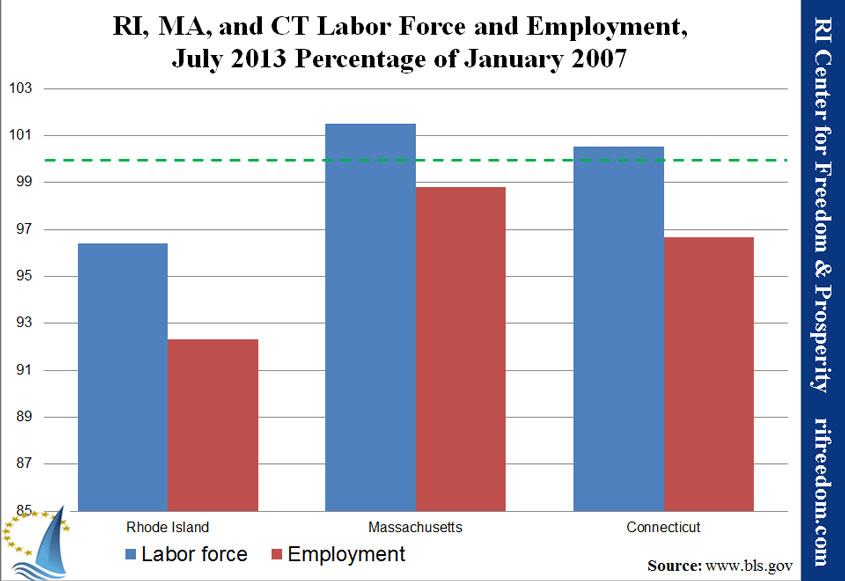
The second chart shows that the Ocean State remains well behind Massachusetts and Connecticut.  A comparison of this chart from month to month would show Rhode Island’s relative position worsening.

RI-laborforceandemp-0107-0713

RIMACT-laborforceandemp-0713perc0107

Rhode Island Employment Snapshot, June 2013: Still Steady, Now Down-Leaning

Rhode Island’s unemployment held at 8.9%, despite a decrease in employment and the size of the labor force. In other words, the state is still stuck in its rut.  The federal Bureau of Labor Statistics (BLS) has not yet updated its quarterly release of “alternative” state-to-state unemployment levels, but if Rhode Island’s U-6 rate increased at the same rate as the national U-6 rate, it will be over 17%.  That’s the measure that includes not just those who’ve said they’ve looked for work in the past month, but also those who haven’t looked for work for a longer period plus those who say they are only working part time, while wanting full-time employment.

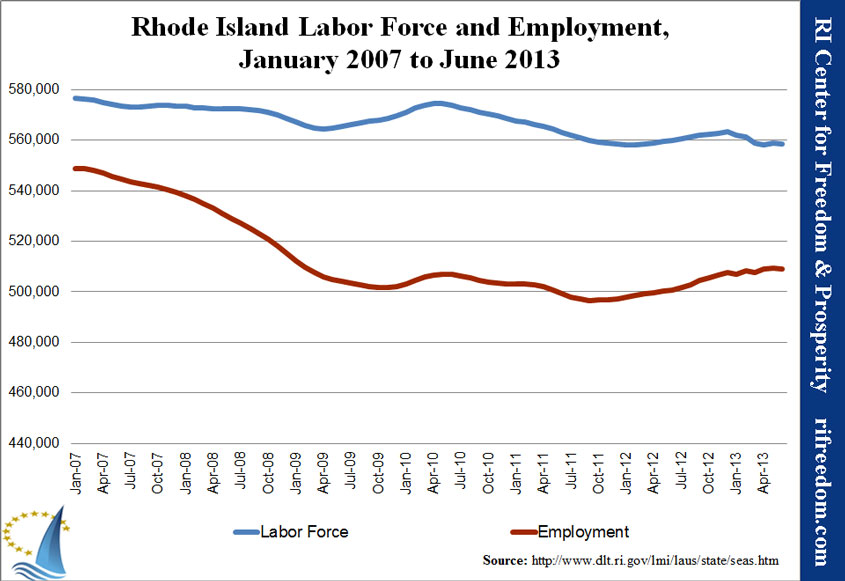
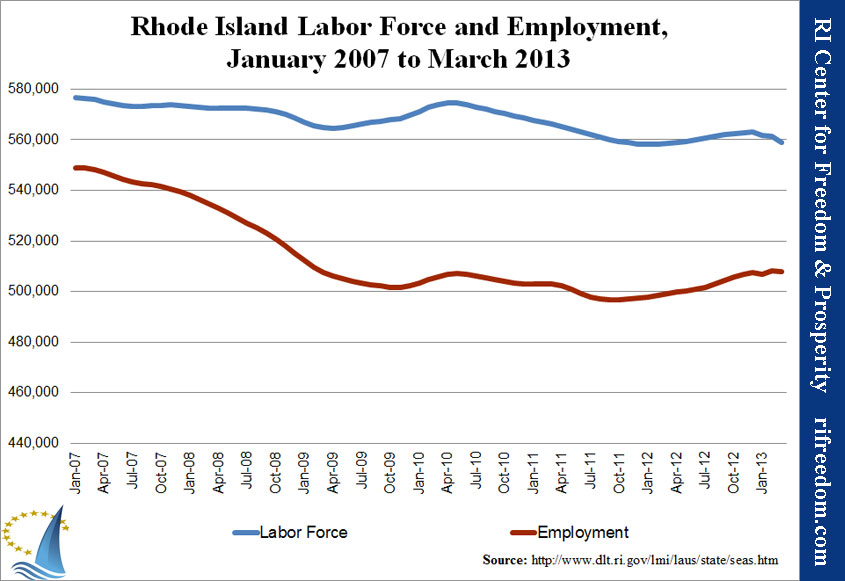
The first chart below shows that the employment situation’s mild gyrations are pretty much sticking to a horizontal line of no improvement.

The second chart shows that the Ocean State still has a long way to go to reach its January 2007 level of employment, and once again remains well behind Massachusetts and Connecticut.

RI-laborforceandemp-0107-0613

RIMACT-laborforceandemp-0613perc0107

Rhode Island Employment Snapshot, March 2013: Slipping

Rhode Island’s unemployment rate fell again, down to 9.1%. If that’s good news, however, then the state’s strategy must really be to get people to give up on ever finding work.

The first chart below shows that employment slid a little, creating a trend mainly of stagnation. But it appears that the bottom may be falling out from under the total labor force (those either employed or looking for work). But for the decrease in the number of people looking for work, Rhode Island still wouldn’t be able to claim to be out of the worst three states for unemployment.

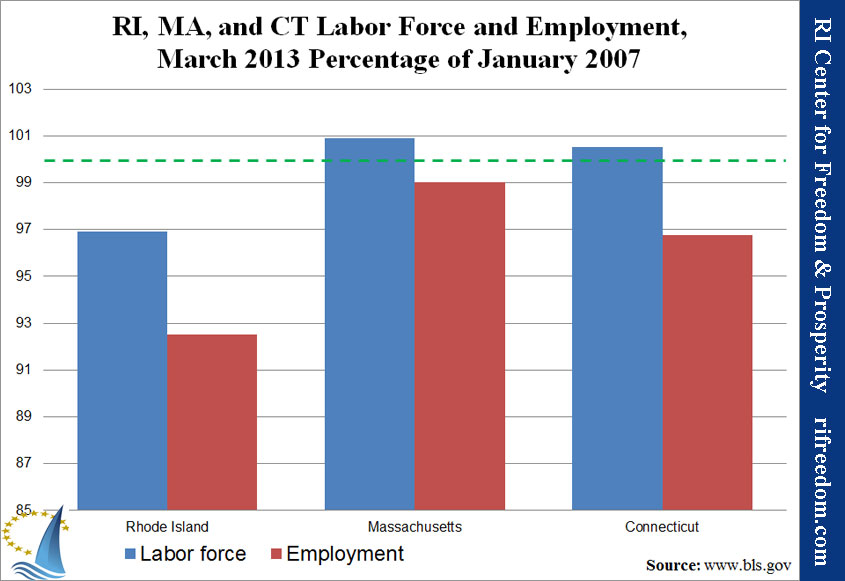
The second chart shows that the Ocean State still has a long way to go to reach its January 2007 level of employment, and once again remains well behind Massachusetts and Connecticut, although Connecticut has been closing the gap through its own downslide.

Rhode Island Labor Force and Employment, January 2007 to March 2013

RI, MA, and CT Labor Force and Employment, March 2013 Percentage of January 2007