NOVEMBER JOBS SNAPSHOT: Lower Unemployment Rate Paints Inaccurate Picture
FOR IMMEDIATE RELEASE
December 21, 2015
RI Unemployment Rate Again Paints False Picture
Center to publish new Jobs & Opportunity Index in 2016
Providence, RI — For the second month in a row, the November unemployment rate for Rhode Island appears to paint an incomplete and misleading snapshot of the true jobs and economic picture in the state, according to a monthly analysis by the nonpartisan RI Center for Freedom & Prosperity. As in October, the lower state unemployment rate, seemingly a positive, was the result of two negative pieces of data: lower overall employment and a smaller labor force (a result of people giving up looking for work).
While the U.S. Bureau of Labor Statistics (BLS) measures six levels of unemployment, U1 thru U6, it is only the U3 unemployment rate that is the basis for the official monthly unemployment rate: U3 narrowly measures the number of unemployed people as a percentage of the labor force. However, U3 is largely dependent on labor force size; so in keeping with the trend of recent months in Rhode Island, when the labor force drops, usually considered a negative economic indicator, it generally produces a lower U3 unemployment rate, which is conversely seen as a positive.
In November of 2015, Rhode Island’s unemployment rate dropped to 5.2%, from 5.3% in the prior month. But, similar to October data – employment levels actually dropped (by 770 people) and 1,461 Rhode Islanders gave up looking for work, thus shrinking the labor force.
“To hear politicians crow about our state’s lower unemployment rate is misguided,” said Research Director Justin Katz, “two losses don’t make a real gain; and this pattern has persisted for years. There’s much more going on in our state that lawmakers should be aware of.”
Among the specific findings in the November analysis:
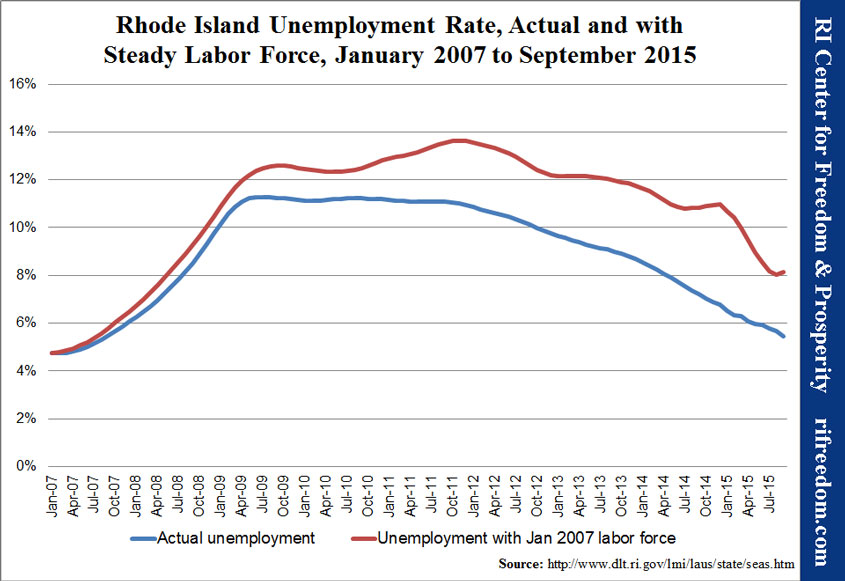
- RI’s unemployment rate would have increased to 8.3% if the state had maintained the same size labor force at it had before the recent recession
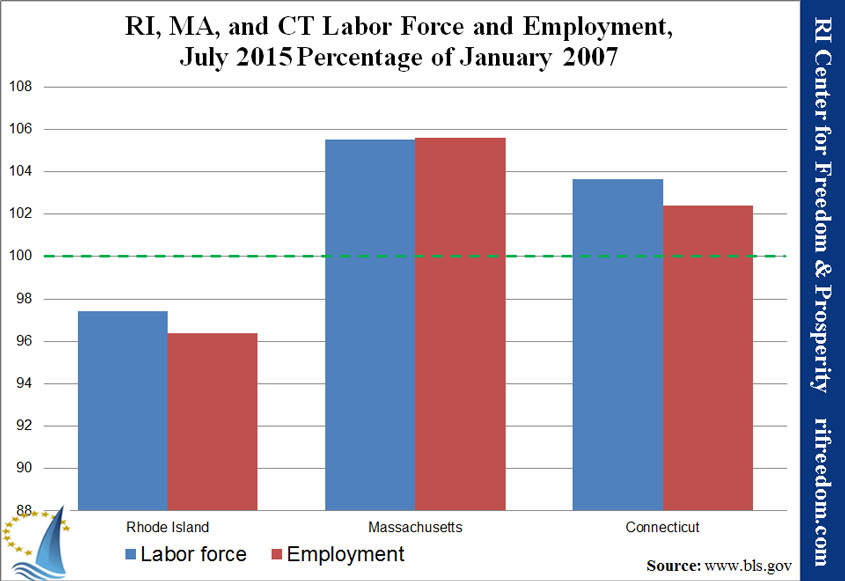
- RI lags far behind its MA and CT neighbors in terms of recovering its employment and labor force levels since before the recent recession
For graphs, charts and a more detailed analysis of Rhode Island’s November employment status click here.
New JOI Index in 2016: In order to account for this labor force vs unemployment rate contradiction and to provide Rhode Islanders with a broader and more accurate picture of the state’s actual jobs market, in Q1 of 2016, the Center plans to publish a monthly Jobs & Opportunity Index, which will incorporate other BLS unemployment categories and which will also measure the size and scope of the state’s private sector as compared with the size and scope of state government.
Rhode Island Employment Snapshot, November 2015: Expected Down Note as Last Report of the Year
[Click here for the printable one-page PDF of this post.]
The trend that has come to define Rhode Island’s employment picture in 2015 (indeed, since the end of the recession) continued for the final Bureau of Labor Statistics (BLS) report for the year. In November, Rhode Island’s unemployment rate dropped to 5.2%, from 5.3% in October. That’s 28 straight months of decreases in the rate of at least one-tenth of one percent. As usual, however, the positive rate resulted from two bits of negative data. Employment actually dropped by 770 people, but 1,461 Rhode Islanders stopped looking for work.
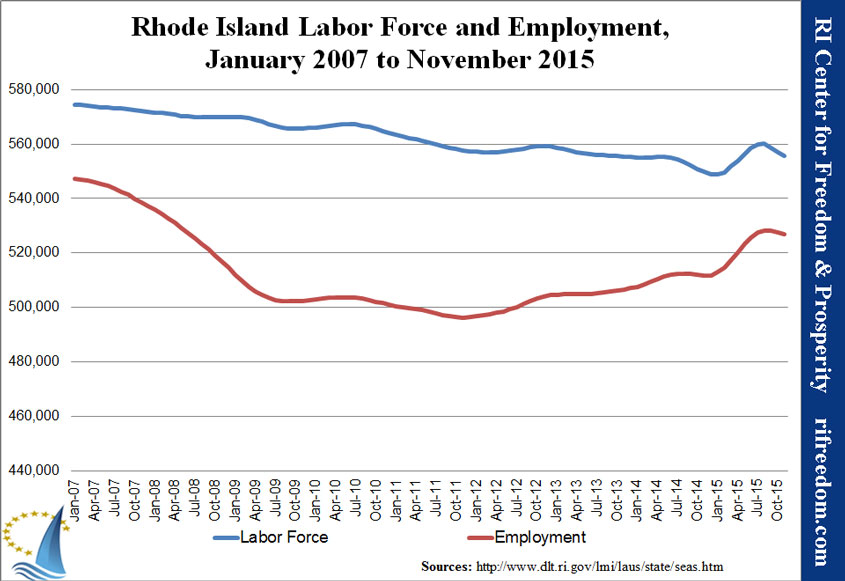
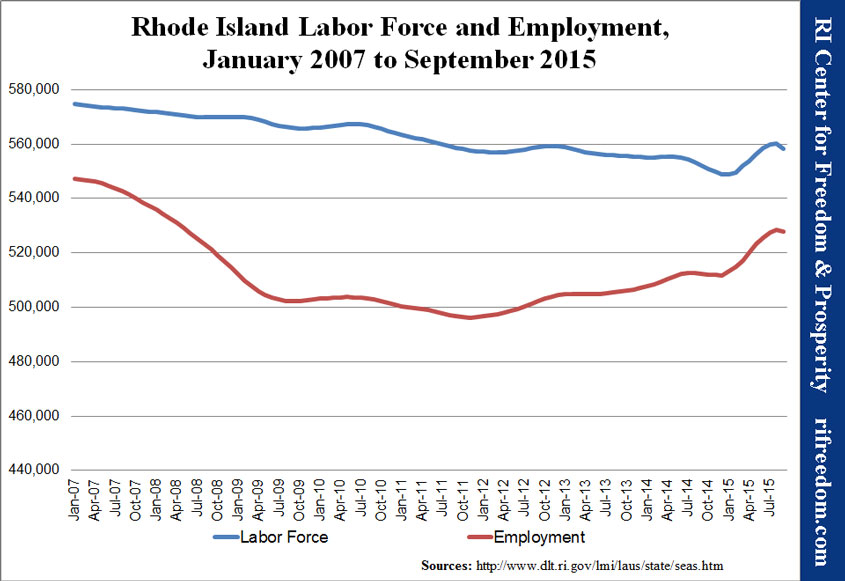
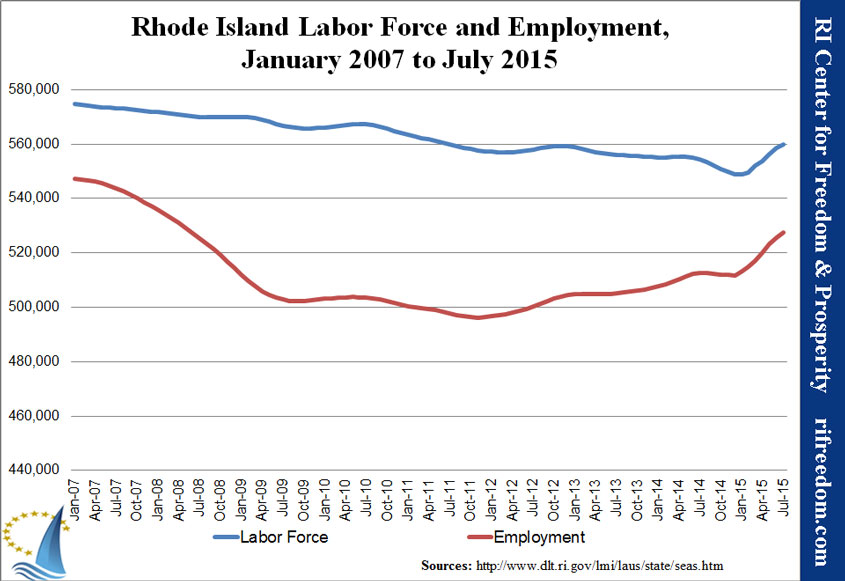
The first chart shows that November’s results continued a downturn in Rhode Island’s underlying employment results. Although the annual revision due next month may shift the picture quite a bit, the state’s labor force (those employed or actively looking for work) is nearly back where it was in the middle of 2014, erasing both a sharp downturn at the end of that year and an even bigger increase for the first half of this year.
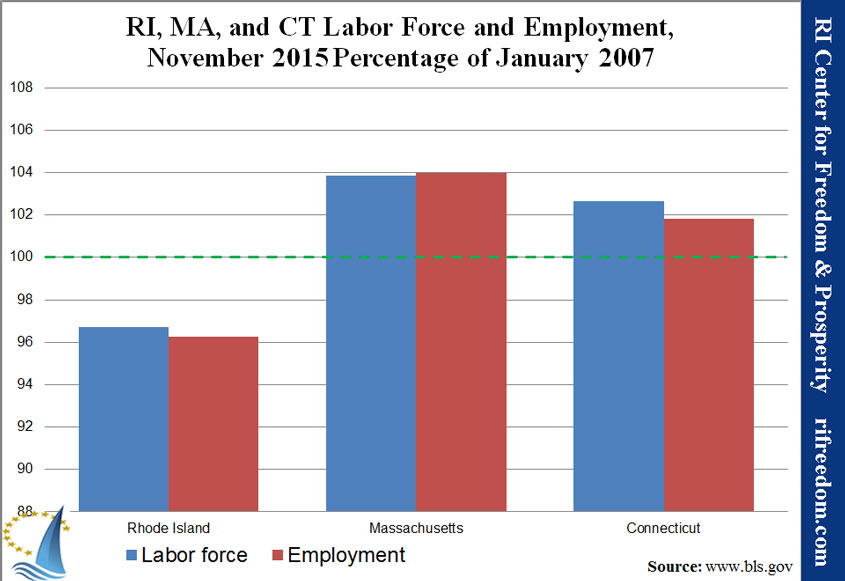
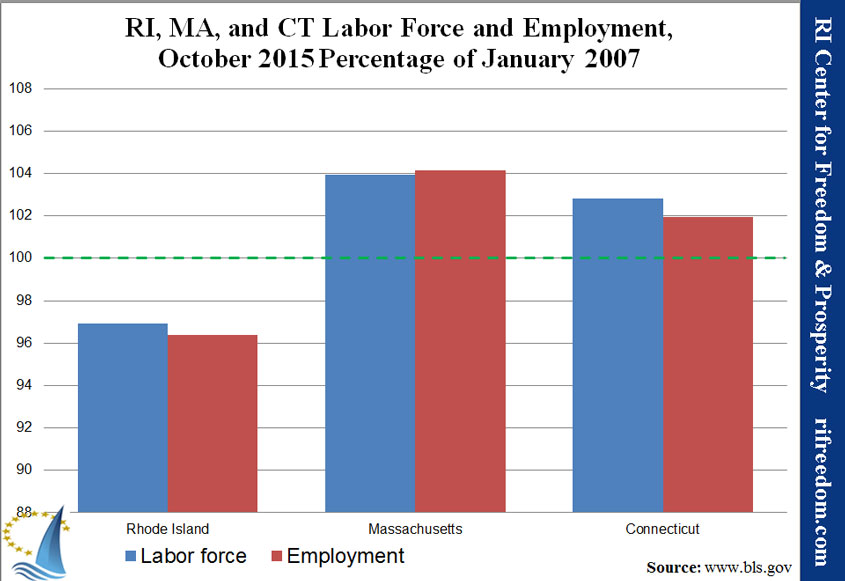
November was another month in which New England was almost unique in losing employment, with all six states bucking a national trend of increases. The columns in the second chart are consequently smaller for both Massachusetts and Connecticut, this month, but Rhode Island remains the only Southern New England state well below its January 2007 level of employment and labor force.
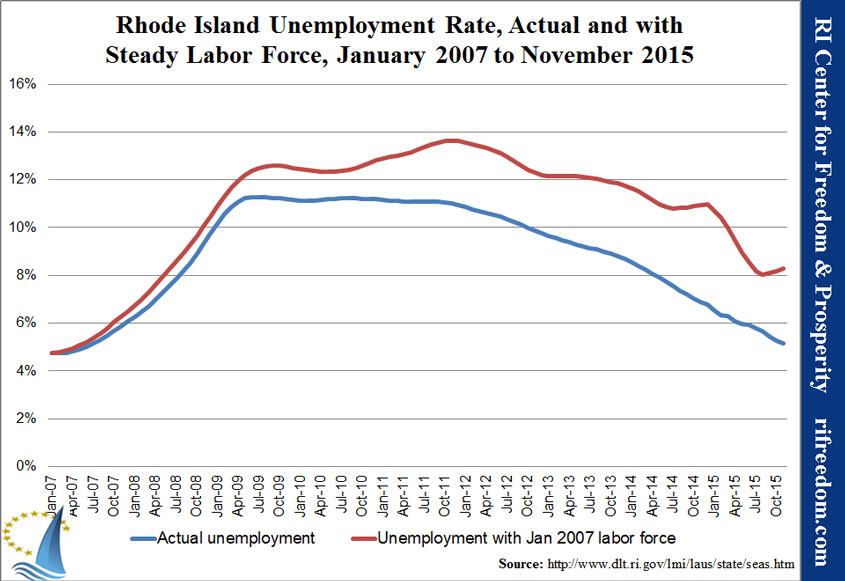
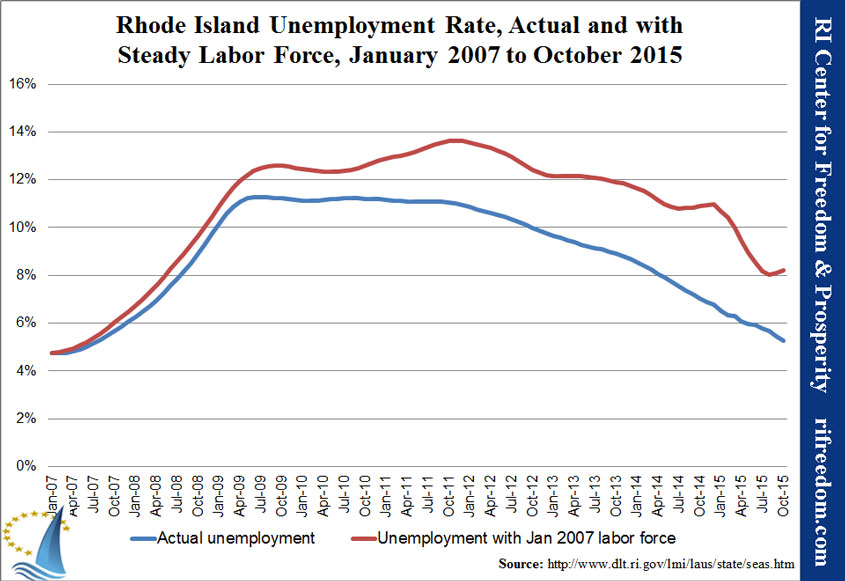
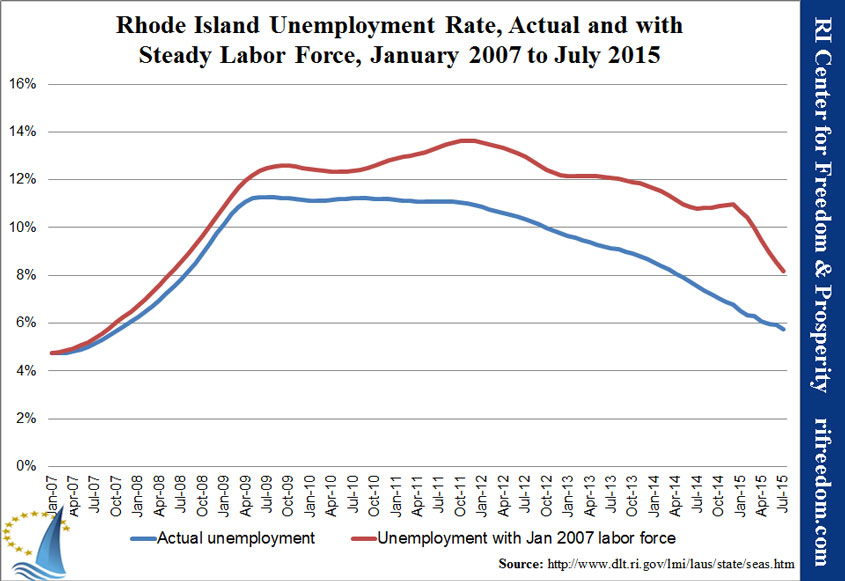
The third chart illustrates the fundamental problem of the official unemployment rate. The red line shows what Rhode Island’s unemployment rate would have been if the labor force had not shrunk since January 2007. As of November, the unemployment rate would actually be going back up, having never dipped below 8%. For November, it would have increased to 8.3%.
Statement: Ocean State Jobs Picture Not As Rosy As It Seems
FOR IMMEDIATE RELEASE
November 25, 2015
RI Employment Picture Tainted by Dwindling Labor Force
Center to publish new quarterly jobs index in 2016
Providence, RI — The traditional monthly unemployment rate, widely reported by most news outlets, often paints an incomplete and misleading snapshot of the true jobs and economic picture in the state, according to a monthly analysis by the nonpartisan Rhode Island Center for Freedom & Prosperity.
While the U.S. Bureau of Labor Statistics (BLS) measures six levels of unemployment, U1 thru U6, it is only the U3 unemployment rate that is regularly cited: U3 narrowly measures the number of unemployed people as a percentage of the labor force. However, U3 is largely dependent on labor force size; so when the labor force drops, usually considered a negative economic indicator, it generally produces a lower U3 unemployment rate, which is conversely seen as a positive.
For instance, in October of 2015, Rhode Island’s unemployment rate dropped, from 5.4% in September, to 5.3% in October. But, as has often been the case, that apparent positive outcome is the result of two negative trends; employment levels actually dropped (by 630 people) and 1,636 Rhode Islanders gave up looking for work, thus shrinking the labor force.
“The falling unemployment rate is the one statistic that Rhode Island politicians like to cite as evidence of economic progress,” said Research Director Justin Katz, “but two losses don’t make a gain. If our state’s poor business climate hadn’t driven so many people out of its labor force since the recession, unemployment would never have dipped below 8%, and it would be on its way back up, right now.”
Among the specific findings in the October analysis:
- RI’s unemployment rate would be 8.2% if the state had maintained the same size labor force at it had before the recent recession
- RI lags far behind its MA and CT neighbors in terms of recovering its employment and labor force levels since before the recent recession
For graphs, charts and a more detailed analysis of Rhode Island’s October employment status click here.
In order to account for this contradiction and to provide Rhode Islanders with a broader and more accurate picture of the state’s actual jobs market, in Q1 of 2016, the Center plans to publish a quarterly Jobs Opportunity Index which will incorporate all six BLS Unemployment categories. The other BLS U-categories more broadly take into account such measurements as underemployed and discouraged workers; people who are willing to work, but for whatever reason, have not looked for work or who are working only on a part-time basis – yet who do not fit the narrow U3 definition of “unemployed”.
Media Contact:
Justin Katz
401-835-7156 | jkatz@oceanstatecurrent.com
Mike Stenhouse, CEO
401.429.6115 | info@rifreedom.org
About the Center
The nonpartisan RI Center for Freedom & Prosperity is Rhode Island’s premiere free-enterprise research and advocacy organization. The mission of the 501-C-3 nonprofit organization is to return government to the people by opposing special-interest politics and advancing proven free-market solutions that can transform lives by restoring economic competitiveness, increasing educational opportunities, and protecting individual freedoms.
Rhode Island Employment Snapshot, October 2015: Two Losses Don’t Make a Gain
[Click here for the printable one-page PDF of this post.]
For yet another month, Rhode Island’s unemployment rate dropped, from 5.4% in September, to 5.3% in September, according to data from the federal Bureau of Labor Statistics (BLS). And for yet another month, that positive outcome resulted from two negative results. Employment actually dropped by 630 people, but 1,636 Rhode Islanders gave up looking. Meanwhile, jobs based in the state increased by a mere 100 after a sizable drop the month before.
The first chart shows that October’s results represent a turnaround in Rhode Island’s employment fortunes. (Although the likelihood remains that the year’s early increases will be revised away.) The trend of large early gains which are revised downward substnatially has been established for several years, now.

Every state in New England lost employment, in October, so the columns in the second chart are smaller for both Massachusetts and Connecticut, this month, but Rhode Island remains the only Southern New England state well below its employment and labor force as of January 2007.
The third chart is the most illustrative of the skepticism that readers should have when watching the unemployment rate, the red line shows what Rhode Island’s unemployment rate would have been if the labor force had not shrunk since January 2007. As of October, the unemployment rate would actually be going back up, having never dipped below 8%. For October, the unemployment rate would be 8.2%.
NEW: Failing RI Report Card Grades Not Advancing Social Justice
FOR IMMEDIATE RELEASE
November 17, 2015
Non-Competitive Grades Harming Work, Mobility, and Opportunity for Rhode Islanders
Preponderance of Fs and Ds Should Signal Need for Change in Policy Culture
Providence, RI — The opportunity for upward mobility for many Ocean Staters continues to be hampered by a non-competitive business climate and onerous family tax burdens, as evidenced by the poor grades the State of Rhode Island received on the 2015 Report Card on Rhode Island Competitiveness, the fourth annual such report, released today by the Rhode Island Center for Freedom & Prosperity.
Burdened with public policies that discourage work and a productive lifestyle, the state’s poor grades in 10 major categories (two F’s, seven D’s, and one C) reflect a government culture geared to benefit special interest insiders, while at the same time promoting job-crushing and soul-crushing dependency among the general populace.
Raising even further alarm, Rhode Island ranked dead-last, overall, when compared with report cards from other New England states.
“This report card clearly demonstrates the wreckage that decades of liberal policies have wrought upon our state. These unacceptable grades should be a wake-up call to lawmakers that a government-centric approach is not producing the social justice and self-sufficiency that Rhode Islanders crave,” suggested Mike Stenhouse, CEO for the Center. “If we want to provide more mobility and opportunity for our neighbors and entrepreneurs, we must completely reform our public policy approach. We must learn to trust in our people and remove the tax and regulatory boot of government off of their backs by advancing policies that empower the average family with choices, that reward work, and that grow the economy.”
The two categories with F grades are Infrastructure and Health Care; the seven D’s are Business Climate, Tax Burden, Spending & Debt, Employment & Income, Energy, Public Sector labor, and Living & Retirement in Rhode Island; while Education received a C-. Among the 52 sub-categories evaluated, Rhode Island received 19 F’s, 24 D’s, 5 Cs, 3 Bs, and just one lone A.
In a related 1-page brief, the Center also analyzes report card trends over recent years as well as comparisons to grades for other New England states.
The RI Report Card, originally developed for the Center by a national economist, compiles into a single document the state rankings among key economic and social indexes, as published by dozens of credible 3rd party national organizations.
The 2015 report card, with citations, as well as reports from prior years can be downloaded at RIFreedom.org/RIReportCard.
Media Contact:
Mike Stenhouse, CEO
401.429.6115 | info@rifreedom.org
About the Center
The nonpartisan RI Center for Freedom & Prosperity is Rhode Island’s premiere free-enterprise research and advocacy organization. The mission of the 501-C-3 nonprofit organization is to return government to the people by opposing special-interest politics and advancing proven free-market solutions that can transform lives by restoring economic competitiveness, increasing educational opportunities, and protecting individual freedoms.
Rhode Island Employment Snapshot, September 2015: Growth Stops in Employment and Jobs
[Click here for the printable one-page PDF of this post.]
Once again, Rhode Island’s unemployment rate dropped, from 5.7% in August, to 5.4% in September, according to data from the federal Bureau of Labor Statistics (BLS). That was, however, a silver lining built on an entirely dark cloud. Employment actually dropped by 521 people, but 1,860 Rhode Islanders gave up looking. At the same time, the number of jobs based in the state fell by 1,800 — for a total drop of 3,700 from July.
The first chart below shows that this dip follows a long increase in employment and labor force. However, the number of jobs based in the state has been relatively stagnant, suggesting that the employment numbers will be revised downward at the end of the year. Employment data is based on a phone survey that the BLS conducts in each state and heavily adjusts according to benchmarks and assumptions about seasonal changes.
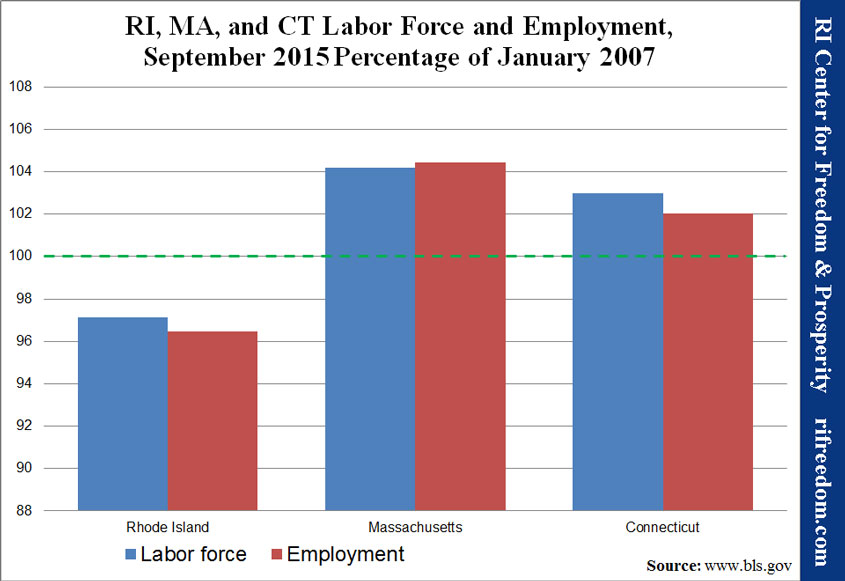
In the second chart, both Massachusetts and Connecticut are down from last month’s results. Still, Rhode Island alone remains well below its employment and labor force as of January 2007.
The third chart is the most illustrative of the skepticism that readers should have when watching the unemployment rate. The red line shows what the curve would have been if the labor force had not shrunk since January 2007. In that case, the unemployment rate would still be 8.1% and would have begun edging back up, in September.
Rhode Island Employment Snapshot, July 2015: RI the Gem of the Southern New England Economy
[Click here for the printable one-page PDF of this post.]
With another drop in unemployment, to 5.8%, July was another banner month for the Rhode Island economy, according to data from the federal Bureau of Labor Statistics (BLS). That showing was on the strength of a 1,299 gain in the workforce from revised numbers for June and a 2,086 increase in employment.
As the first chart below shows, 2015 has brought an unabated boom in employiment, in Rhode Island — at least according to these statistics. Employment data is based on a phone survey that the BLS conducts in each state and heavily adjusts according to benchmarks and assumptions about seasonal changes.
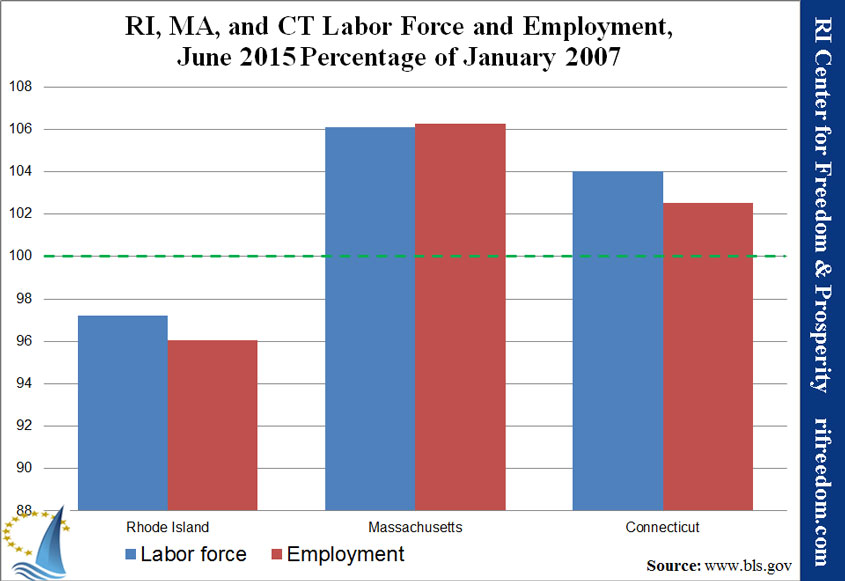
The second chart shows that Rhode Island remains well below its employment and labor force as of January 2007 and that this is unique in Southern New England. Comparing this chart to last month’s
iteration, however, would show that Massachusetts and Connecticut are headed in the other direction. If one believes the numbers, Massachusetts lost more than 21,000 employed residents, while Connecticut lost nearly 2,000.
How Rhode Island is moving in the other direction isn’t immediately clear.
The third chart illustrates the significance of the size of the labor force. The red line shows what the curve would have been if the labor force had not shrunk since January 2007, and it ends in a conspicuous cliff. In June, unemployment would still have been 8.2%. Even that represents a huge drop, over the course of this year so far, from 11.0% in December.
Rhode Island Employment Snapshot, June 2015: RI Bucks Southern New England Trend?
[Click here for the printable one-page PDF of this post.]
The June employment data from the federal Bureau of Labor Statistics (BLS) provides a good lesson in a number of the ways in which the data can be misleading. For one thing, looking at the unemployment rate, one could say that Rhode Island dipped below 6% for the first time since November 2007. Of course, one could have said the same thing last month. But the BLS revised May up to 6%, so the Ocean State gets to repeat its milestone.
As the first chart below shows, this has been a banner, booming year, for Rhode Island. More and more people are looking for work and, at least when it comes to the statistics, more and more people are finding it. The curious thing is that this growth has been unabated for so many months, yet the news and anecdotes around Rhode Island wouldn’t lead one to expect such a boom. Indeed, in June, the number of jobs available in Rhode Island, as measured by another BLS dataset, actually went down. Readers should keep in mind that two years in a row have brought dramatic downward revisions come the following January.
Another bit of conflicting information is related to the second chart. The fact that Massachusetts and Connecticut are doing so much better than Rhode Island, when it comes to making up for losses during the recession, is not new. What’s new is that Massachusetts and Connecticut slowed or lost ground in June, while Rhode Island’s sprint continues. That could be accurate, but it seems unlikely.
The third chart illustrates the significance of the size of the labor force. The red line shows what the curve would have been if the labor force had not shrunk since January 2007, and it ends in a conspicuous cliff. It also illustrates that Rhode Island has a long way to go, even according to the questionable statistics. In June, unemployment would still have been 8.5%. Even that represents a huge drop, over the course of this year so far, from 11.0% in December.