House Economic Development Bills and the General Assembly Freedom Index

In light of the RI Center for Freedom & Prosperity’s release of its 2013 General Assembly Freedom Index Snapshot the day after the Rhode Island House of Representatives passed its leadership’s economic development package, a note joining the two may edify the public.

In short, we believe that the six bills that passed the House (now to proceed to the Senate) will have an overall negative effect on Rhode Island’s economic and civic well-being. The three negative bills are:

  • 6063-SubA: to create an Executive Office of Economic Development to oversee multiple state governments, including Business Regulation, Labor and Training, and others, and coordinate all government activities affecting the state’s economy. The office would be run by a new Secretary of Economic Development appointed by the governor.
  • 6071: to change the Economic Development Corp. into the Commerce Corp. and increase its reporting requirements to the General Assembly. The legislation would also add a layer of supervision, with a new Secretary of Commerce appointed by the governor having final authority and a chief operating officer running the day-to-day operations.
  • 6068-SubA: to create a “Rapid Rhody lending program” within the proposed commerce corporation to offer fast financing to small businesses that have been operating in the state for a year and promise to remain for another two years.

All of these bills would consolidate economic authority — increasing power to dictate the direction of the state’s economic activity — within the hands of a small group of largely unelected government officials. The third of the bills would do so by providing taxpayer resources to government agents to hand out to select businesses, which would both socialize the risk of those businesses’ not succeeding and interfere with the market forces that allow an economy to move its resources where they can do the most good.

The three other bills in the package, we view as likely to be inconsequential:

  • 6069-SubA: to require each new gubernatorial administration to create an Economic Development Planning Council with at least 15 members chosen from inside and outside of government to plan economic policy for the state.
  • 6070-SubAaa: to create a Council of Economic Advisors with nine members appointed by the governor to advise him or her on matters related to economic policy and to publish reports and analysis.
  • 6067: to create a state business development center within the proposed commerce corporation that would “provide a concierge-level of call service” to walk businesses through government requirements and possibly offer business-to-business services.

A handful of legislators did vote against some of these six bills, and it did have an effect on their rankings, with the top and bottom 10 now as follows:

House
Top 10 Bottom 10
1 Chippendale -19.4 75 Edwards -83.1
2 Trillo -29.0 74 Williams -80.7
3 Newberry -29.0 73 Valencia -80.7
4 Costa -41.9 72 Slater -80.7
5 Giarrusso -41.9 71 Silva -80.7
6 O’Neill -42.7 70 Shekarchi -80.7
7 Dickinson -47.6 69 Serpa -80.7
8 Morgan -50.0 68 Palangio -80.7
9 San Bento -52.4 67 O’Grady -80.7
10 Nunes -54.8 66 Messier -80.7


For bill tracking and descriptions, see Rhode Island Votes.

2013 Rhode Island General Assembly Freedom Index Snapshot

Download: Freedom Index 2013 Scorecard Snapshot

Rhode Island families can expect further downward pressure on their prosperity this year as a result of the actions of their own elected officials, based on a snapshot scoring of 55 tracked bills already voted on through May 22 of 2013.

Overall, the RI General Assembly has garnered a negative (-54.7) rating on its overall “Freedom Index”.  Further, not a single state legislator rated in positive figures.

The annual General Assembly Freedom Index by the RI Center for Freedom & Prosperity scores Ocean State lawmakers on their level of support for principles of freedom as proven by their votes on the floors of the House and Senate. This preliminary scorecard provides a snapshot of the scores as of May 22, 2013, so that voters and legislators can develop a better-informed evaluation of their progress and priorities as the General Assembly approaches its final push.

The index examines legislators’ votes in terms of their likely effect on the free market, the size and scope of government, the balance of residents’ interests against those of public employees and beneficiaries, and the constitutional structure of a divided government with limited power over the people whom it represents. The Center reviewed every bill submitted in either chamber and collected votes tallies for those that received roll-call votes on either floor. (Companion bills only count once.)

The resulting scores give a detailed sense of each legislator’s priorities beyond a few high-profile issues. Each legislator’s votes can be found on RhodeIslandVotes.org, and full vote tallies and bill weightings will be published with the final index as described below.

The Center further divided the bills into five categories:

  • Tax & budget: bills that affect the tax structure in Rhode Island and/or that relate to government expenditures, just driving or relieving the pressure on taxation
  • Regulatory environment: bills that make it more or less difficult to live and do business in the state by imposing regulations
  • Constitutional government: bills that affect the structure of the government, as well as the scope of government in its authority over residents’ lives
  • Public sector labor: bills related to the relationship between its employees and itself and the electorate
  • Education reform: bills that advance or impede the reform of the state’s public education system, in terms of both cost and quality

Most legislation has implications for more than one of these categories. For the purposes of this index, we applied our subjective sense of the area of core effect and sorted the bills accordingly. If, for example, a bill having to do with education seemed to us intended to secure the role of public employees, we classified that bill as Public Sector Labor, not Education Reform.

Download: Freedom Index 2013 Scorecard Snapshot

2013 Freedom Index Findings

Fifty-five (55) different pieces of legislation (counting companion bills once) were evaluated. The Center judged 41 of them as having a negative effect on freedom.

The average legislator index score of -54.7 indicates that the General Assembly has been moving Rhode Island in the wrong direction, and that Rhode Islanders will be less free than they were in 2012. By comparison, last year’s average index score was -25.4, so this legislative session has so far been more destructive than the previous. This index underscores our Center’s view that the 2013 RI General Assembly is not positively addressing the dire business and living climate of our state.

Top and Bottom 10

House Senate
Top 10 Bottom 10 Top 10 Bottom 10
1 Chippendale -14.8 75 Edwards -80.6 1 O’Neill -30.9 38 Goldin -49.1
2 Giarrusso -33.3 74 Williams -77.8 2 Hodgson -33.8 37 Cool Rumsey -49.1
3 Trillo -33.3 73 Valencia -77.8 3 Picard -33.6 36 Goodwin -48.2
4 Newberry -40.7 72 Slater -77.8 4 Bates -34.6 35 Satchell -47.7
5 Costa -40.7 71 Silva -77.8 5 Kettle -34.6 34 Crowley -46.8
6 Morgan -42.6 70 Shekarchi -77.8 6 Cote -34.6 33 Pearson -46.8
7 San Bento -45.4 69 Serpa -77.8 7 Algiere -35.0 32 Lombardo -46.8
8 Nunes -48.2 68 Palangio -77.8 8 Raptakis -35.9 31 Archambault -45.5
9 Corvese -54.6 67 O’Grady -77.8 9 Ciccone -36.4 30 Jabour -45.5
10 Carnevale -56.5 66 Messier -77.8 10 Ruggerio -37.7 29 Sosnowski -45.5


Other findings include;

  • Average House index of -68.0 (from 2012 average of -24.1)
  • Average Senate index of -41.8 (from 2012 average of -27.9)
  • Average Democrat index of -62.1 (from 2012 average of -33.5)
  • Average Republican index of -35.0 (from 2012 average of 16.5)
  • Average Regulatory Environment index of -78.3 (from 2012 average of -49.0)
  • Average Tax & Budget index of -44.3 (from 2012 average of-26.0)
  • Average Constitutional Government index of -17.6 (from 2012 average of -9.1)

Download: Freedom Index 2013 Scorecard Snapshot

Index Overview

The Center selected legislative bills for inclusion in the Freedom Index if they were deemed to have an effect on free-market, small-government, or constitutional principles, with each bill assigned a positive or negative weighting based on the criteria listed below. Weighted points for each bill were given to each legislator based on his or her roll-call vote on it.

Each legislator’s final Freedom Index was calculated as his or her score’s percentage of the total possible points. A positive score indicates a 2013 voting record that generally protected individual and economic freedoms, while a negative score reflects the opposite.

Disclaimer: It should be noted that the total Freedom Index score generated for each legislator is a direct reflection of the perspective of the RI Center for Freedom & Prosperity when it comes to the weighting of each bill. The Freedom Index is not an absolute measure of a legislator’s merit and does not constitute any endorsement or individual criticism. The Freedom Index is a tool designed for general research and for accountability, giving voters some quantitative metrics for their own assessments as to their elected legislators’ performance.

For more detailed notes and methodology, download the PDF:  Freedom Index 2013 Scorecard Snapshot

Individual Property Rights in the Cross Hairs in the Ocean State

Homeowners, businesses, and other property owners should be aware that a series of bills under consideration in the Rhode Island General Assembly would undermine or erode their individual property rights — the foundation of the U.S. Constitution and the free-enterprise system.

In the name of vague environmental resource benefits, three bills in particular would systematically give the state, or new state and local agencies, authority to infringe upon the rights and freedoms of local property owners.

It appears that the state is seeking a larger role in centrally planning, mandating, or influencing how local land or property may or may not be utilized. The plans are so invasive that Rhode Islanders may be left wondering whether they own their land or merely lease it temporarily from the government.

1) House Bill 6099 would create a new, quasi-public statewide Ocean State Regional Water Authority, with a board consisting of a majority of members appointed by the mayors of Providence, Cranston, and North Providence, ostensibly with the goal of ensuring that enough water is available to communities throughout the state.

Perhaps most egregiously, the new Water Authority would have the power to enter without permission onto any property in Rhode Island to examine the land and drill and dig into the ground. It would also have powers of eminent domain, to take land that the board determines it needs for current or future use. It would also set rates for water and have authority to place liens on properties of delinquent customers, as well as to shut off their water.

The bill further allows the state to purchase or lease from the Providence water system or other local organizations that currently operate such systems and to bring in water from out of state. The purchase or lease price would not be not subject to Public Utilities Commission (PUC) or Division of Public Utilities and Carriers (DPUC) approval or proceedings, and the costs would be passed on to water customers via increased rates.

“(c) Notwithstanding anything in the general laws to the contrary, and without limiting the provisions of section 46-32-11 set forth above, neither the Rhode Island public utilities commission nor the Rhode Island division of public utilities and carriers shall have any jurisdiction, authority, or other power to approve, reject, review, or in any way affect any acquisition or the terms of any purchase and sale agreement or lease agreement.”

Going even farther, the legislation explicitly prohibits the PUC and DPUC from requiring that the water authority’s purchase or lease payments “benefit, directly or indirectly… the water ratepayers.” In this case, the question of ownership is broader: In publicly held water districts, the taxpayers and ratepayers are responsible for the liabilities of their systems, but under this legislation, they would not likewise be recipients of any of the benefits of ownership.

2) House Bill 5633 and Senate Bill 696 would use state grants and matching funds to pressure cities and towns to create “community preservation committees” (with a majority vote from residents), which would research and implement land purchase and development deals in keeping with ideals of sustainable development. The legislation would allow cities and towns to impose up to an additional 3% tax (renamed as a “surcharge”) on local property that would not be counted in any calculations or limits on the property tax levy.

The state would provide matching funds up to 100% of the additional surcharge, with the money coming from (among other places) an additional $20 fee on all real estate recording instruments (e.g., deeds).

In creating these new local committees, these bills would provide a new path for “affordable housing” or other “green” projects to be approved and funded locally. This presents two potential issues for existing property owners.

First, it is not unusual that the resulting subsidized developments are taxed at lower rates than most others — while existing property owners are subject to higher rights, even surpassing existing caps. This tax level disparity would make it significantly more expensive to live in unsubsidized areas.

Second, these committees, in furthering their preferred land purchase and development deals, may exempt projects from local zoning ordinances.  In contrast, the way the legislation is constructed, the state government could impose requirements that the towns would have to follow. (One example already in the bill is a ban on “artificial turf.”)

While existing local governments would technically have to pass related projects and mandates, it isn’t clear whether the legislation permits them not to do so.

Unelected officials, coordinated and trained via a statewide infrastructure with its own agenda, would have new powers to determine local land use that would create disparate and inequitable tax structures. That all Rhode Island property owners would be forced fund this questionable activity via fees on standard transactions and new, renamed property taxes is clearly a program that infringes on property rights.

3) House Bill 5801 would require any “greenhouse gas emissions source” (as defined by the state Dept. of Environmental Management) in or doing business in Rhode Island to increase its tracking and reporting to the state, as well as impose direct fees on them for use of the DEM. The legislation would also make greenhouse gas emissions a focus of state economic development activities.

By charging commercial property and business owners additional fees or causing them to incur unnecessary expenses for conducting or reporting normal business activities, the state would be infringing on the rights of those owners.

Further, the idea that restricting or charging for greenhouse gas emissions can somehow be considered a serious part of an economic development activity is preposterous. Such fees would only be a further detriment to an already weak state economy that has been hampered by similar dubious statutes in the first place.

38 Questions on the Superman Building

Would Saving Superman be Kryptonite to RI’s Economy?

Opinion

Local developer Arnold “Buff” Chace of Cornish Associates and a Massachusetts real estate investment fund, High Rock Development, recently released a “redevelopment plan” for the property at 111 Westminster Street in Providence’s Financial District popularly referred to as “The Superman Building.”  As the Providence Journal reports, the plan requires state-taxpayer-funded public subsidies of $39 million, $21 million in federal-taxpayer-supported tax credits, and up to $15 million in city-taxpayer-supplanted tax forgiveness in order convert a 441,000 square foot building from office use to primarily residential use.

$75 million … sound familiar? Given the disastrous track record of Rhode Island’s “public-private partnerships” of late, the Rhode Island Center for Freedom & Prosperity thought it might be appropriate to pose certain questions relating to the request.  38 questions, in fact.

38 Questions

1.    Did we learn nothing from 38 Studios?  With many multi-million-dollar years ahead of us to cover a failed gamble on subsidized video games, one would think that the state’s ability to adequately analyze this sort of massive investment and its risks would be a matter of suspicion.

2.    Is this a priority for the state?  Have we solved enough of our education, social services, and infrastructure problems to justify applying our treasure and attention to a massive, risky, and speculative real estate investment?

3.    If we do have budget dollars to spare, why wouldn’t we invest them in infrastructure improvements that benefit all economic drivers?  We can think of at least one bridge that could lose its looming tolls faster than a speeding bullet.

4.    Do the voters responsible for this big check get a say as to whether they want to be in the apartment building investment business?  Does their Constitution require their approval of such expenditures, or at least a legislative supermajority? (Should it?)

5.    If you call it a tax credit, but you then let the developer sell it to other taxpayers, isn’t it just a really inefficient way of handing out a multi-million-dollar corporate welfare check?

6.    Why do we need to involve tax credit brokers, anyway?  It would be a lot easier to keep track of all the people who stand to profit if the money flowed out of the state check book? Or would transparency be like Kryptonite to the superpowers of the deal makers?

7.    How about a tax-credit lottery? Tens of thousands of small businesses would love not to pay their full tax liabilities for a year or two.

8.    According to the developer, 775 office buildings are in the City of Providence, representing over 15 million square feet of space.  Do subsidies to one disadvantage the other 774?

9.    For that matter, why not redirect the $75 million in subsidies to pay most of the first-year cost of the proposed elimination of the state sales tax?  The Center’s Zero.Zero plan, currently before the General Assembly, would put that money in the pockets of every individual Rhode Islander and every business.  That would spark new economic activity, not just moving dollars from one neighborhood or town to another.

10.    Why can’t the developer phase in the conversion over time, using profits for additional remodeling?  They project that “stabilization” of the downtown Providence office market will take 12 to 15 years, saying it would take 24 to 30 years if we don’t give them piles of taxpayer money (Advisors Inc. Economic and Fiscal Impact Study dated April 25, 2013 [HR&A], page 26).  Cautious, phased-in funding over 5 to 10 years would achieve the same goal without the up-front risk.

11.    For that matter, its own market study says that the Class A office market in Providence is seeing its lowest vacancy rate in 10 years and that midsize office suites could generate $25 per square foot in rent.  Is that really not viable, or is it just harder to hide previous losses in smaller projects?

12.    And while we’re at it, how can the HR&A report (page 30) claim that the “magnitude” of the project implies that the spending is “net new”?  They seem to be arguing that 95% of the spending is “new to the region” because a project of this size “would not have otherwise taken place” without the taxpayer subsides.  If Rhode Islanders have that much money lying around doing nothing, perhaps the developers should just take up a collection.  Or maybe there’s a reason the project can’t gather funding without involving politics and taxes.

13.    Why does the developer get to retain $15 million in declared value while arguing functional obsolescence at the same time?  If you need this bailout to keep the lights on (literally), isn’t the building really worth nothing?

14.    Is it somehow our problem that the owners paid too much for the building in the first place?  In the nation’s 46th worst (of 51) real estate market, there are probably a lot of bad bets still shaking out around the state. Should other property owners start putting the word “iconic” in all of their materials?

15.    The various “public-private” redevelopment successes touted by the developers in other states don’t seem to have required quite the same sort of taxpayer-funded cash in hand.  Can they cite a successful effort that invested a similar amount of taxpayer money on a per-square-foot basis that wasn’t an investment in public infrastructure or funding traded for equity?

16.    Did the building owners have an appraisal done when purchasing the building in 2008?  They say they’ve spent $39,200,000 to date on the property.  Since we’re being asked to make the same investment, shouldn’t we know their upfront purchase price, how much they’ve spent since then, what they were paid in rent over the years, and what they have taken out in management fees and profits?

17.    Would a private investor get in league with someone whose own numbers indicate a loss of almost $25 million in five years on this project?

18.    Who’s on the hook for the bad investment?  Who invested the equity to allow the company to purchase the property, and who loaned them the money?  Who are we really bailing out here?

19.    More bluntly, does our proposed multi-million-dollar subsidy go to the new development, or does the plan include paying off old debt or old investors?

20.    What is the tax value of the write-down to the developer and/or its investors or lenders?  Will the state see the claimed $120,000 in corporate income taxes (HR&A, page 33)?  Will the EDC exempt the sales tax on construction materials?  Will the millions in federal payroll tax dollars that leave Rhode Island during construction be counted as an offset and a negative economic impact?

21.    The report calls the proposed rate of return for investors “below market,” at 2–6%. So what exactly is motivating an investor to invest?  Love of DC Comics–style architecture? Will there actually be other new investors, or will RI taxpayers be left holding Superman’s cape?

22.    If we later find out that the money players who are already over their skis on the project are taking the reduced return instead of losing everything, would that be called “fraud”?

23.    What kind of development fees, management fees, or other payouts to the developer, its investors, or its lenders are going to be made during the life of the project?

24.    Specifically, what do we get for $3,105,678 in “legal & professional” fees and $3,342,050 in “administration & development” fees?  (Would it be too bold to ask who exactly gets that $6,447,728?)

25.    If it’s an investment, do we get equity?  If the developer puts in $10,000,000 and we put in $40,000,000, do we get 80% ownership?

26.    How can the developers claim that the $75 million will drive economic activity without subtracting the $75 million that taxpayers will no longer have? Simply taking it from us and spending it yourself does not yield new economic activity.  A better term than the repeatedly used “generate” (HR&A, page 2, for example) would be “relocate” (or perhaps “redistribute”).

27.    Who thinks it is a compelling argument that the project will save $740,000 in lost property tax revenue over the long term?  The subsidies amount to roughly 100 times that amount. If we took those tens of millions and simply lowered the commercial tax rate in the City of Providence and across Rhode Island by eliminating the two-tiered tax system that today punishes and drives out businesses, it might lead to new tenants downtown and push up property values and assessments.

28.    In the absence of such market forces, where will the anticipated tenants come from?  Won’t they just leave the suburbs or the neighborhoods and move to the subsidized building?  Which cities and towns will lose the professional residents the project intends to attract?

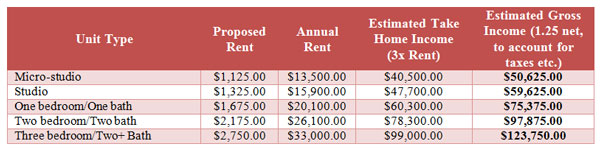
29.    Who’s going to get those Burnside Park views?  The developers’ “tenant profile” talks about “young professionals, older professionals, Boston commuters, empty nesters, and students.”  Not exactly those most in need.  This table of expected annual incomes for each unit type assumes that housing costs represent about one-third of take-home income. In that case, our average beneficiary is making around $75,000 per year.

38questions-table1

30.    Is welfarequeenus hipsterus a rare breed of urban parasite noted for its aversion to suits and Windows-based products and its keen sense that everybody else can afford to pay a bit more for their greater good?

31.    Man of Steel aside, if we’re subsidizing “stainless steel appliances” and “granite kitchen and bathroom counters,” can we leave our doggie bags there when we go out for a night on the town after dinner? How about using the “24 hour fitness center” and “24 hour concierge/security”?

32.    Given the roughly $75 million in total proposed handouts, the proposal amounts to a subsidy of about $200 per square foot for 265 new households (HR&A, page 34.)  That kind of money builds a nice house; how about we just build a bunch of those and give them away?  That certainly seems more equitable than subsidizing one tall building in a single bound.

33.    How can they characterize a projected 104 jobs as economic growth?  Aren’t the people who will live there economically active today?  Same goes for resident spending estimates (HR&A, page 36.)  Even if every resident moved here from out of state, the HR&A study (page 38) only projects $697,000 in annual revenue to the State of Rhode Island, for which it calculates a net present value of $8,600,000.  So we invest $39 million in cash, and another $36 million in incentives, and we know on day one that over $60 million of that subsidy is a write off? Wouldn’t it be a better investment to spend $105 million to eliminate the sales tax and clear a path for 25,000 jobs?

34.    How can they claim a “multiplier effect” from jobs that are presumably mostly here already?  The “IMPLAN” model (HR&A, pages 41–43) for estimating economic impacts and multiple effects is certainly respected and credible for its purposes, but the HR&A study utterly misuses it.  The IMPLAN model assumes new economic activity, not simply the shifting of resources within the state; that’s more like a TRANSPLAN.

35.    Are we crazy to think that myopic economic analyses, absurd corporate welfare handouts, and inept economic meddling contributed to the fact that “Rhode Island’s economy suffered more from 2008 to 2012 than the neighboring New England states,” as the developer’s market study puts it?

36.    Mightn’t a broad-based reform help replace the roughly 1.5% population loss the study anticipates for the state with population and economic growth?  As the developers’ own analysis notes, we have 35,900 fewer jobs in Rhode Island today than we had at the peak of 2006.  Take out the 112,000 largely government funded healthcare and education sector jobs, and the 49,700 or so public sector jobs (U.S. Census Bureau 2011 Data for Full Time Equivalent Employment, state and local), and our current private employment of 388,000 is around 10% below the peak.

37.    If this deal ends in disaster, and taxpayers lose again, do we at least get the consolation prize of watching some political player get banished to Krypton?

38.    In the spirit of Rhode Island’s economic development habit of ending up where it began, we’ll close with: Did we learn nothing from 38 Studios?

On a Serious Note

Many years ago, the EDC liked to talk about “traded services” as the types of activities that represent economic growth for a state.  They are not activities that occur simply because of their proximity to the local market.  For example, a restaurant is not a traded service, because people will not travel to South Carolina for dinner.  On the other hand, jewelry manufacturing is a traded service, because another state can provide incentives or an economic environment that would draw that business away.

It follows that economic development policy should be focused on activities that are portable, or traded.  To subsidize non-traded services is simply to shift resources from one pocket to the other, while dropping a few dollars on the ground in costs and expenses.

Moving a Rhode Islander from Pawtucket to Providence is economic activity, but it is not economic growth.  The same can be said for the new dry cleaner or coffee shop that the resident will now frequent.  The construction activity for a new Providence apartment may be simply offsetting the same type of construction activity back in Central Falls.

Except that Pawtucket, Central Falls, and the other cities and towns in the state will never know what might have been.

Rhode Island General Assembly Freedom Index

The first-annual General Assembly Freedom Index by the RI Center for Freedom & Prosperity scores Ocean State lawmakers on their level of support for principles of freedom as proven by their votes on the floors of the House and Senate.

[button url=”http://www.rifreedom.org/2012/09/ri-general-assembly-freedom-index/” target=”_self” size=”small” style=”royalblue” ]Read More…[/button]

RI Medicaid Abuse Puts New Spin on “Laundering” Taxpayer Dollars

Unionized laundry workers at the Eleanor Slater Hospital, and throughout the Department of Behavioral Healthcare, Developmental Disabilities and Hospitals (BHDDH), routinely double or even triple their salaries to take home over $123,000 per year.

[button url=”http://www.rifreedom.org/2013/03/ri-medicaid-abuse-puts-new-spin-on-laundering-taxpayer-dollars/” target=”_self” size=”small” style=”royalblue” ]Read More…[/button]
Get Government Out of the Way; Tear down the legislative barriers to success

Get Government Out of the Way

To revive the Ocean State’s failing economy and to restore prosperity to our citizens, we recommend the state re-embrace free-enterprise principles and tear down the legislative barriers to success that have been erected over recent decades.

[button url=”http://www.rifreedom.org/2012/10/get-government-out-of-the-way-a-free-market-solution-for-the-ri-economy/” target=”_self” size=”small” style=”royalblue” ]Read More…[/button]

Online Merger of The Ocean State Current and Anchor Rising

Providence, RI — The Rhode Island Center for Freedom and Prosperity announced today that its online journalism and commentary wing, The Ocean State Current, will be merging the content of Anchor Rising into a single location on The Current’s existing website and URL.
The co-branded joint venture, launched today at OceanStateCurrent.com, will now also feature content from an experienced team of Anchor Rising contributors who set the standard for conservative blogging in Rhode Island, including Andrew Morse, Marc Comtois, Monique Chartier, and Patrick Laverty.

Founded in 2004, Anchor Rising is Rhode Island’s most prominent blog for conservative news and commentary about politics and public policy. Justin Katz, one of Anchor Rising’s founding members, and editor of The Ocean State Current, also serves as the Center’s research director. “Moving the state forward toward less-waning waters’ is arguably no longer sufficient at a time when the keel appears to be scraping the bottom of the bay. We’ve reached the point of dredging, and that requires greater focus and greater unity of purpose”, said Katz.
RI Center for Freedom & Prosperity CEO Mike Stenhouse says, “With this new quality content, we feel the Current-Anchor website is now the premiere online opinion area for advancing free-market, small government views in the entire state.We also intend to continue producing hard-hitting investigative journalism pieces as with the recent stories about excessive overtime payments to government workers.”

Anchor Rising’s deep archives will remain in their original locations on the Internet, and readers can access the original archive site through the arvhive link on the new, combined page.

Public and Private Sector Compensation Comparison

State and local government workers enjoy significantly higher compensation levels than their private sector counterparts, according to data compiled for Rhode Island as part of a national study conducted by economists William Even, of Miami University, and David Macpherson, of Trinity University.

[button url=”http://www.rifreedom.org/2012/11/ri-public-and-private-sector-compensation-comparison/” target=”_self” size=”small” style=”royalblue” ]Read More…[/button]

Rhode Island Employment Snapshot, March 2013: Slipping

Rhode Island’s unemployment rate fell again, down to 9.1%. If that’s good news, however, then the state’s strategy must really be to get people to give up on ever finding work.

The first chart below shows that employment slid a little, creating a trend mainly of stagnation. But it appears that the bottom may be falling out from under the total labor force (those either employed or looking for work). But for the decrease in the number of people looking for work, Rhode Island still wouldn’t be able to claim to be out of the worst three states for unemployment.

The second chart shows that the Ocean State still has a long way to go to reach its January 2007 level of employment, and once again remains well behind Massachusetts and Connecticut, although Connecticut has been closing the gap through its own downslide.

Rhode Island Labor Force and Employment, January 2007 to March 2013

RI, MA, and CT Labor Force and Employment, March 2013 Percentage of January 2007