RI General Assembly 2016 Session Freedom Index
Download: Freedom Index 2016 Scorecard; legislator votes, bill explanations, and rankings
Go to main Freedom Index page.
2016 Freedom Index Findings
Ninety-eight (98) different pieces of legislation (counting companion bills once) were evaluated. The Center judged 80 of them as having a negative effect on freedom.
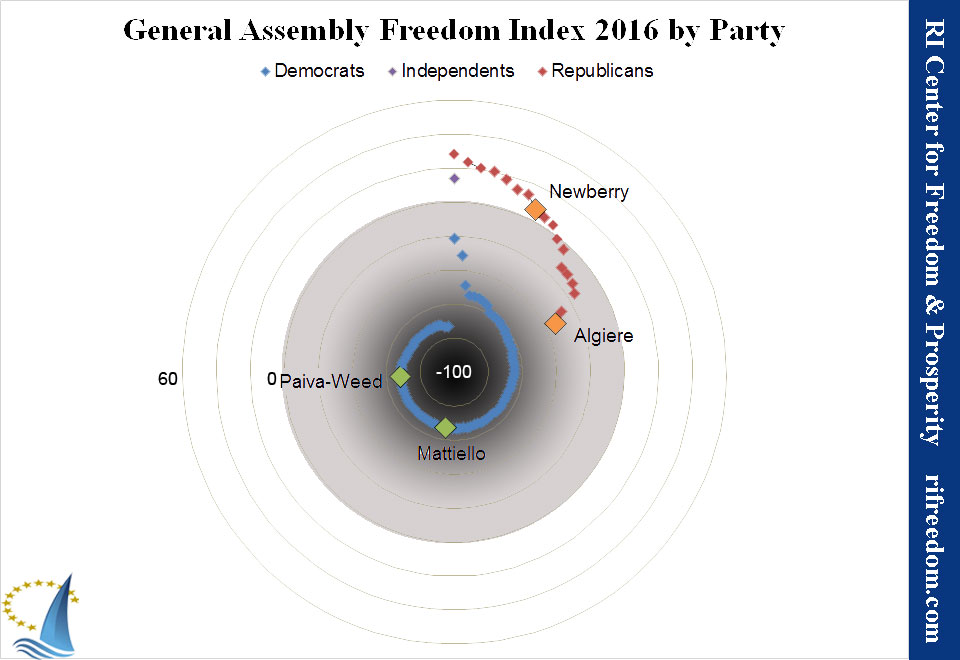
The average legislator index score of -54.1 indicates that the General Assembly moved Rhode Island in the wrong direction, albeit slightly less than in the prior year, and that Rhode Islanders are less free than they were in 2015. (The lowest possible score is -100.)
Although the General Assembly, overall, took a step backward in 2016, the Center’s review of bills prior to floor votes on it (as much as possible) contributed to a much greater number of positive scores than in any year since 2012. Eleven legislators achieved positive scores, whereas the none did so in the prior two years and only two accomplished positive scores in 2013.
Other findings include:
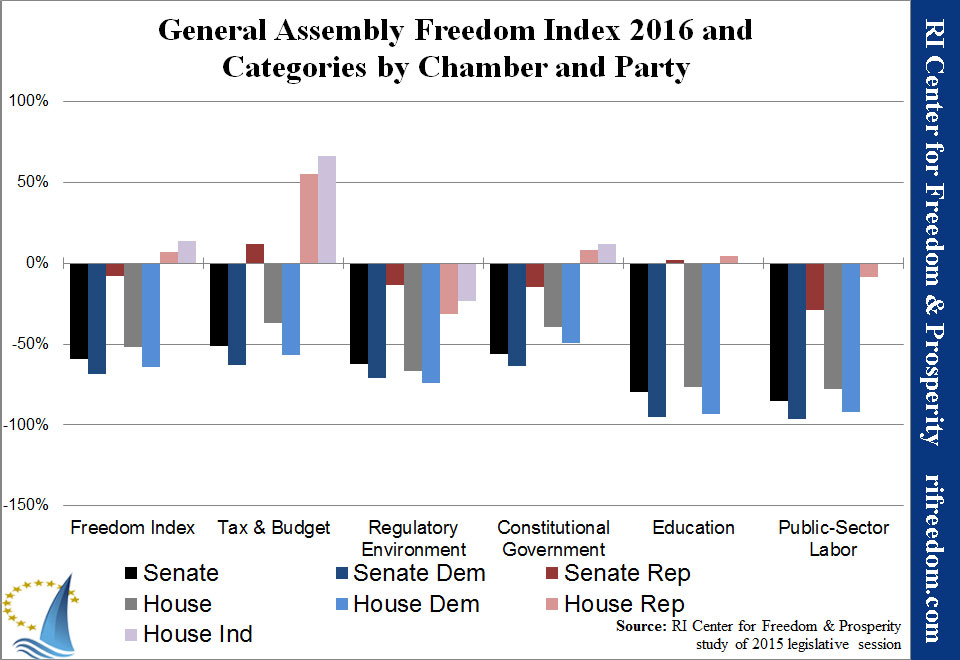
- Average House index of -51.6 (up from -55.4)
- Average Senate index of -59.2 (down from -58.8)
- Average House Democrat index of -64.0 (down from -61.6)
- Average House Republican index of 7.0 (up from -23.0)
- Average Senate Democrat index of -68.8 (down from -61.5)
- Average Senate Republican index of -8.2 (up from -43.4)
- Average Regulatory Environment index of -65.2 (down from -53.0)
- Average Tax & Budget index of -41.8 (up from -64.9)
- Average Constitutional Government index of -44.9 (up from -58.4)
- Average Public Sector Labor index of -80.2 (up from -99.2)
- Average Education Reform index of -77.7 (down from -23.3)
Download: Freedom Index 2016 Scorecard; legislator votes, bill explanations, and rankings